Elearnmarkets - Financial Market Learning
  • Categories
    • Basic Finance
    • Derivatives
      • Futures
      • Options
    • Financial Planning
    • Fundamental Analysis
    • Technical Analysis
    • Marketshala
    • Miscellaneous
  • Language
    • English
    • Hindi
    • Bengali
No Result
View All Result
  • Courses
  • Webinars
  • Stories
Elearnmarkets - Learn Stock Market, trading, investing for Free
No Result
View All Result
Home Fundamental Analysis
Retention Ratio (Plowback ratio)

Retention Ratio (Plowback Ratio) – Overview, Formula Examples

Elearnmarkets by Elearnmarkets
August 23, 2023
in Fundamental Analysis, Financial Statement Analysis
Reading Time: 5 mins read
2
1.9k
VIEWS
Share on FacebookShare on XShare on WhatsApp

Listen to this:

Retention ratio is also known as Ploughback ratio.

It is a fundamental analysis ratio that measures the proportion of earnings that is retained back in the business rather than being paid out as dividends to shareholders.

    Table of Contents
   Formula to calculate Retention Ratio
   How Retention Ratio is useful to analyze a stock?
   What are the factors that affect the retention ratio?
   What are the limitations?

It is the opposite metric of Dividend Payout Ratio.

At the end of every fiscal a company generates earnings that may be positive (profits) or negative (losses).

A company with profits provides its management with ample space to utilize this surplus for a number of purposes.

RelatedPosts

Super Successful Techno Funda Stock Market Strategy 4

Super Successful Techno Funda Stock Market Strategy

November 28, 2023
1.4k
How to Identify Thief Companies in the Stock Market? 5

How to Identify Thief Companies in the Stock Market?

September 30, 2023
506
Everything you should know about Dividend Investing 6

Everything you should know about Dividend Investing

October 30, 2023
5.4k

They may decide to pay the entire profit to the shareholders as dividends, can retain it to reinvest for growth purpose or can also opt for a combination of both.

When a company chooses to retain profit or a portion of profit for future growth purposes it is called Retained Earnings, which when expressed as a percentage of total earnings is Retention Ratio.

The retained profit is transferred to the reserve & surplus in the balance sheet which increases the equity of the company proportionately.

Formula to calculate Retention Ratio

The retention Ratio can be calculated using the following two formulae:

(i) The first method to calculate retention ratio involves dividing the increase in retained earnings during the period by net income of the period. That is,

Retention Ratio (Plowback Ratio) - Overview, Formula Examples 1

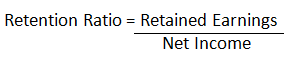
Where, Retained Earnings = Net Income – Dividend Distributed for the year.


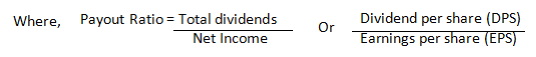
(ii) Another possible way to calculate the ratio is by determining the residual funds on calculating the payout ratio. That is,

Retention Ratio =1- Payout Ratio

Retention Ratio (Plowback Ratio) - Overview, Formula Examples 2

Thus, from the above we understand that the ratio indicates the amount of net profit that has been retained back into the company so that it can be reinvested for future growth and expansion of the business.

How Retention Ratio/Plowback Ratio is useful to analyze a stock?

Retention Ratio (Plowback Ratio) - Overview, Formula Examples 3

What are the factors that affect the retention ratio?

  • When a company is growing, it needs additional cash to finance investment in tangible and intangible assets and also in marketing activities to capture a larger customer base.

  • When a company is looking to explore an acquisition or takeover opportunities that align with its growth and expansion objectives, it will have a higher retention ratio.

  • When a company has taken too much debt, it may retain cash to pay the debt and thus improve its financial risk profile.

  • Capital intensive companies like automobiles, oil production & refining, telecommunication, etc requires large amount of funds to maintain their level of production. So, this type of industry calls for higher retention ratio.

  • The ratio also gets influenced by the company’s earnings volatility and its dividend payment policy.

What are the limitations?

  • The ratio does not always indicate a good financial health of a company. Companies with lower earnings may pay less or no dividends to its shareholders, thus resulting in a higher retention ratio.

  • The ratio does not indicate whether the company is reinvesting the retained funds back into the company or not.

  • The ratio also fails to capture whether the retained capital has been reinvested and whether such reinvestment is done effectively and efficiently.

Key Takeaways

  • Retention ratio is a fundamental analysis ratio that indicates the amount of profit that is retained back into the business for future growth of the business. It increases the retained earnings of the company.

  • Investors may prefer capital appreciation over dividend payments, if the company has high growth potential.

  • The ratio helps to demarcate between defensive and cyclical stocks. Defensive stocks usually do not encounter earnings volatility and thus have stable payout ratio than cyclical stocks, whose earnings are volatile.

  • The ratio, just like any other, should not be studied alone but in conjunction with other financial ratios. Moreover, it should be observed over a period of time to rightly evaluate the performance of the company.

Visit StockEdge to avail carious technical scans and reports of Stock Markets.

Tags: dividendfinancial ratiosintermediateratio analysis
ShareTweetSend
Get Kotak Offer Get Kotak Offer Get Kotak Offer
Previous Post

Long term Investment: Stock Market, Property or Fixed Deposits

Next Post

Understand the basics of Stock Market Functioning

Elearnmarkets

Elearnmarkets

Elearnmarkets (ELM) is a complete financial market portal where the market experts have taken the onus to spread financial education. ELM constantly experiments with new education methodologies and technologies to make financial education effective, affordable and accessible to all. You can connect with us on Twitter @elearnmarkets.

Related Posts

Super Successful Techno Funda Stock Market Strategy 7
Fundamental Analysis

Super Successful Techno Funda Stock Market Strategy

November 28, 2023
1.4k
How to Identify Thief Companies in the Stock Market? 8
Fundamental Analysis

How to Identify Thief Companies in the Stock Market?

September 30, 2023
506
Everything you should know about Dividend Investing 9
Fundamental Analysis

Everything you should know about Dividend Investing

October 30, 2023
5.4k
7 rules of Growth Investing 10
Fundamental Analysis

7 rules of Growth Investing

September 13, 2023
4.5k

Comments 2

  1. Terrance says:
    4 years ago

    I am constantly thought about this, regards for putting up.

    Reply
  2. Sage Sharpless says:
    4 years ago

    I am impressed with this web site, really I am a fan.

    Reply

Leave a Reply Cancel reply

Your email address will not be published. Required fields are marked *

Elearnmarkets Logo

Follow Us

Facebook-f Twitter Instagram Linkedin-in Youtube Telegram

Register on Elearnmarkets

Continue your financial learning by creating your own account on Elearnmarkets.com

Register Free Account

Download App

Playstore logo
Download on app store

Categories

  • Basic Finance
  • Derivatives
  • Financial Planning
  • Fundamental Analysis
  • Technical Analysis
  • Marketshala
  • Miscellaneous

Popular On Elearnmarkets

  • Market Superheroes:
  • Vivek Bajaj
  • Chetan Panchamia
  • Ashish Kyal
  • Premal Parekh
  • Abhijit Paul
  • Jegan
  • Sivakumar Jayachadran
  • Vishal Malkan
  • Jyoti Budhia
  • Vivek Gadodia
  • Vishal Mehta
  • Piyush Chaudhry
  • Santosh Pasi
  • Gomathi Shankar
  • Market Superheroes:
  • Vivek Bajaj
  • Chetan Panchamia
  • Ashish Kyal
  • Premal Parekh
  • Abhijit Paul
  • Jegan
  • Sivakumar Jayachadran
  • Vishal Malkan
  • Jyoti Budhia
  • Vivek Gadodia
  • Vishal Mehta
  • Piyush Chaudhry
  • Santosh Pasi
  • Gomathi Shankar
  • Courses:​
  • Options Trading
  • Dow Theory
  • Momentum Trading
  • Stock Investing
  • Stock Market for Beginners
  • Harmonic Chart Patterns
  • Algo Trading
  • Elliot Wave Theory
  • Advanced Excel
  • Cryptocurrency
  • NSE Certification Course
  • Courses:​
  • Options Trading
  • Dow Theory
  • Momentum Trading
  • Stock Investing
  • Stock Market for Beginners
  • Harmonic Chart Patterns
  • Algo Trading
  • Elliot Wave Theory
  • Advanced Excel
  • Cryptocurrency
  • NSE Certification Course
  • Webinars:
  • Bank Nifty Scalping
  • Intraday Trading Strategies
  • Options Trading Strategies
  • Options selling
  • Price Action
  • Relative Strength
  • Tax Planning
  • Options Buying
  • Growth Stocks
  • Portfolio Management
  • Relative Strength Index
  • Risk Management
  • Renko Charts
  • Crude Oil
  • Traders Psychology
  • Moving Average
  • Multibagger Stocks
  • Free Learning Modules:
  • Intraday Trading
  • Options Scalping
  • Swing Trading
  • Financial Modelling
  • RSI Indicator
  • Bollinger Bands
  • Pricing of Futures
  • Personal Finance
  • Initial Public Offerings (IPO)
  • Value Investing
  • Technical Indicators
  • Candlesticks
  • Chart Patterns
  • Option Greeks
  • ELSS Funds
  • Banking and Insurance
  • Real Estate
  • Gold
  • Book Summaries:
  • Rich Dad Poor Dad
  • Psychology of Money
  • The Intelligent Investor
  • The Richest Man in Babylon
  • Think and Trade Like a Champion
  • Value Investing and Behavioural Finance
  • Trading in the Zone
  • Learn to Earn
  • Book Summaries:
  • Rich Dad Poor Dad
  • Psychology of Money
  • The Intelligent Investor
  • The Richest Man in Babylon
  • Think and Trade Like a Champion
  • Value Investing and Behavioural Finance
  • Trading in the Zone
  • Learn to Earn
  • Tools:
  • CAGR Calculator
  • SIP Calculator
  • eLearnOptions
  • Future Value Calculator
  • Present Value Calculator
  • Atal Pension Yojana
  • Cost of Delay Calculator
  • Become a Crorepati
  • Tools:
  • CAGR Calculator
  • SIP Calculator
  • eLearnOptions
  • Future Value Calculator
  • Present Value Calculator
  • Atal Pension Yojana
  • Cost of Delay Calculator
  • Become a Crorepati

© 2023 Elearnmarkets. All Rights Reserved

  • Visit Elearnmarkets
  • Courses
  • Webinars
  • Financial Guides
  • Get Free Counselling
  • Visit Elearnmarkets
  • Courses
  • Webinars
  • Financial Guides
  • Get Free Counselling

Get Elearnmarkets App

No Result
View All Result
  • Article Categories
    • Basic Finance
    • Derivatives
    • Financial Planning
    • Fundamental Analysis
    • Technical Analysis
    • Marketshala
    • Miscellaneous
  • Language
    • Hindi
    • Bengali
    • English
  • Courses
  • Webinars
  • Stories

© 2020 Elearnmarkets All Rights Reserved

Guide to Basics of Stock Investing
Learn to interpret the financial performance and health of a company.
Download Now