Key Takeaways
- Demand and consumption are not the same: Demand shows how much will be bought at a given price, while consumption is the actual usage influenced by price and supply conditions.
- Quantifying demand is complex: Unlike supply, demand can’t be measured directly and often requires studying past consumption and price data to infer demand curves.
- Consumption depends on price and supply: Higher supply or falling prices can increase consumption even if demand remains unchanged.
- In fixed supply scenarios, price adjusts equilibrium: When supply is limited, consumption reflects available supply rather than demand levels, making price the key balancing factor.
- Demand-supply balance drives price trends: In markets, including stocks, understanding how demand and supply interact helps forecast price movements more accurately.
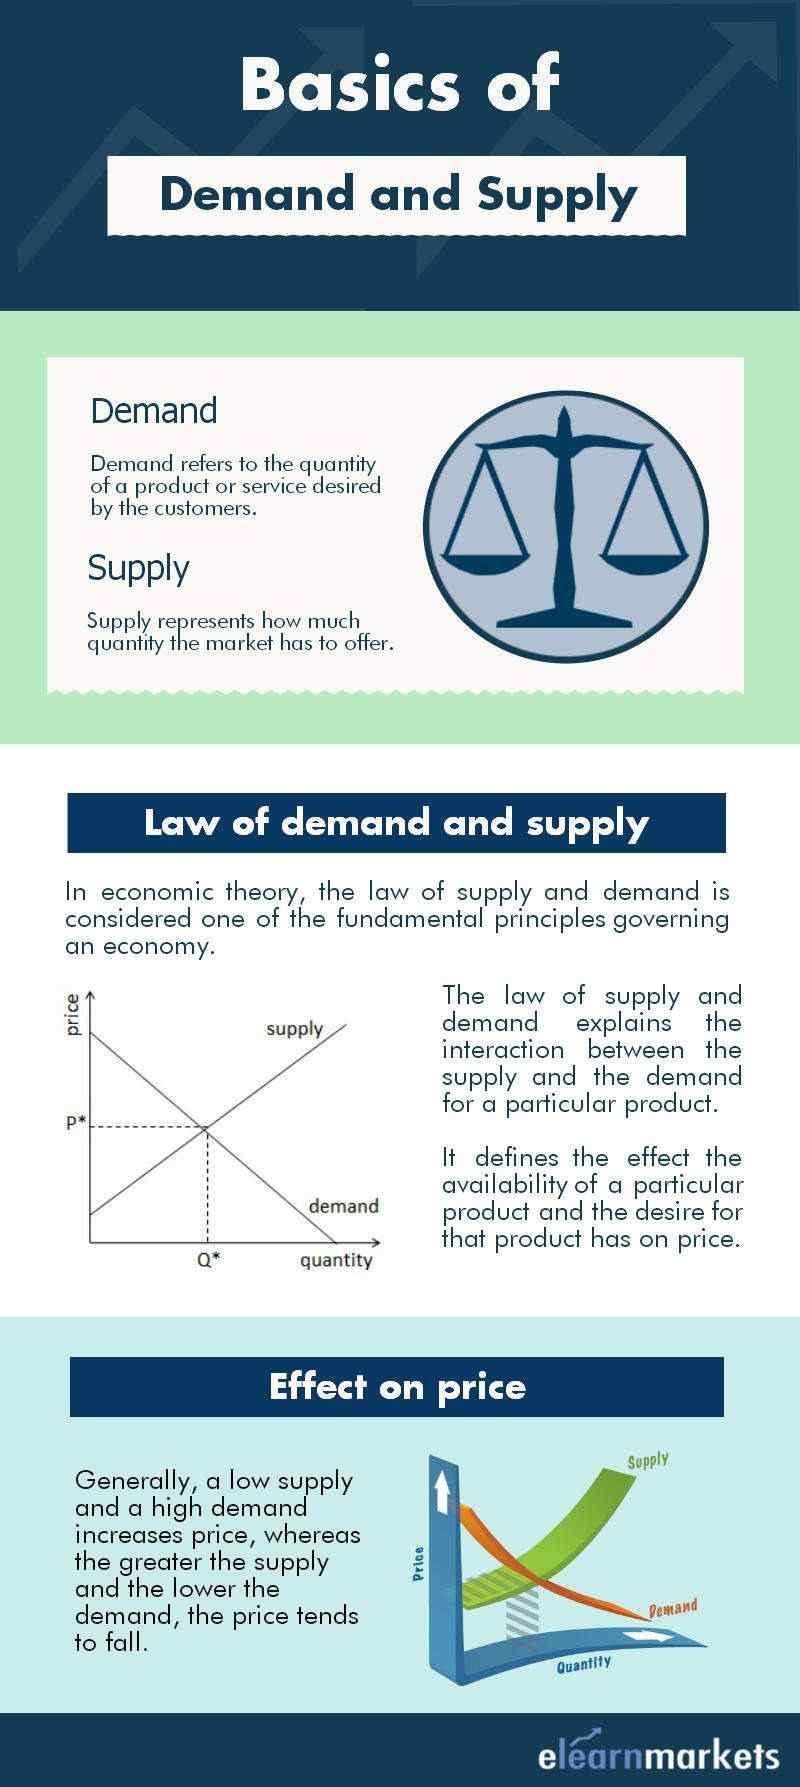
Demand, Supply, Consumption Patterns and the price level are all inter-related to each other. One major problem attached to projecting prices using the relationship between demand and supply pattern is the difficulty in quantifying demand. There is no way to determine the quantity demanded at any given level of prices.
Supply, on the other hand, can be determined easily to a certain extent, for example in case of perishable goods or non-storable goods, based on the production or the stock statistics.
There can be certain exceptions; however, in most of the cases, the supply can be determined as compared to the quantity demanded.
Analyzing demand curves
The only way to determine quantity demanded is through inference of demand curves through a detailed study of the historical consumption pattern and the price data. It is an easy process when the quantity demanded is stable in nature. On the other hand, frequent changes in the pattern of quantity demanded, makes this methodology almost impossible. This difficulty in the quantification of demand can be circumvented by considering consumption figures as a proxy to carry on with the workable analysis of projecting prices. This assumption is wrong, but in order to get a workable figure, we need to know the conceptual mistakes involved in this.
Let us understand the following difference:
Consumption is the amount of goods used and is determined by the price which in turn is determined by the demand and supply factors.
Demand refers to the amount of goods that will be used at any given price level and along with supply determines the price.
Now look at the figures below:
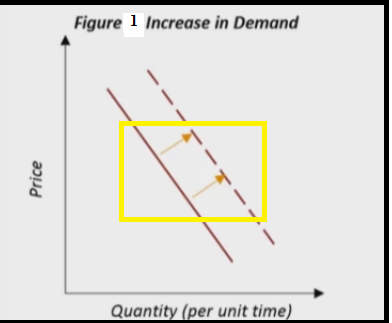
In Fig 1 above, we see an increase in quantity demanded which means that more will be consumed at any given price level. Whereas a mere price decline can increase consumption.
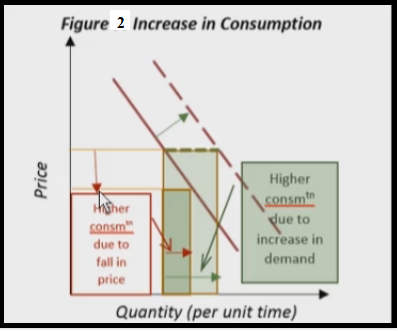
In Fig 2 above, you can see an increase in quantity demanded, wherein the demand curve shifts to the right and at a given price level, there is higher consumption due to increase in quantity demanded.
Whereas you will see that on the same curve, with the decline in prices, an increase in the consumption level with the increased prices.
Increase in quantity demanded can be induced by an increase in disposable income, the price of the substitute goods falling etc. but not by definition due to the price of the goods. Changes in the price itself will not cause a shift in the curve, it will cause changes in the consumption level.
Understanding the relationship between demand and supply
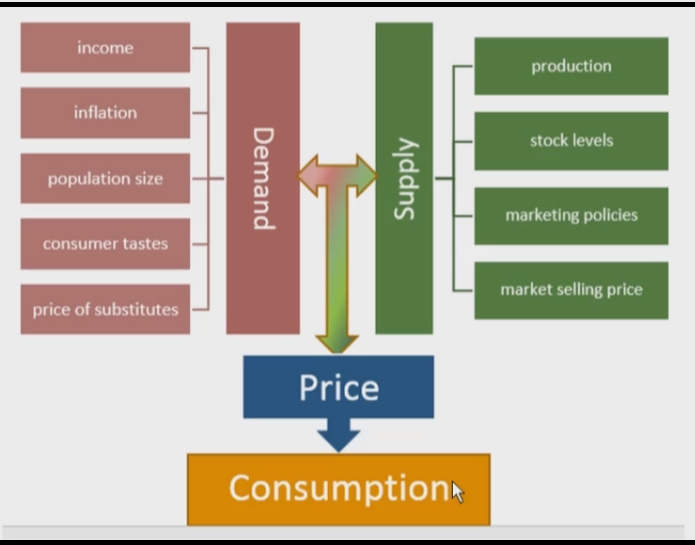
Considering the above figure, we can say the following:
- Consumption is the consequence of price.
- Demand is the determinant of price.
Hence, the use of consumption as a proxy for demand is ERRONEOUS as it is determined by the relationship between demand and supply. Similarly, the law of demand works in the stock market.
Also Read: Basic Toolkit for Stock Market Beginners
Fixed Supply Situations
Let us analyze a situation wherein supply is fixed, for example in case of non-storable perishables.
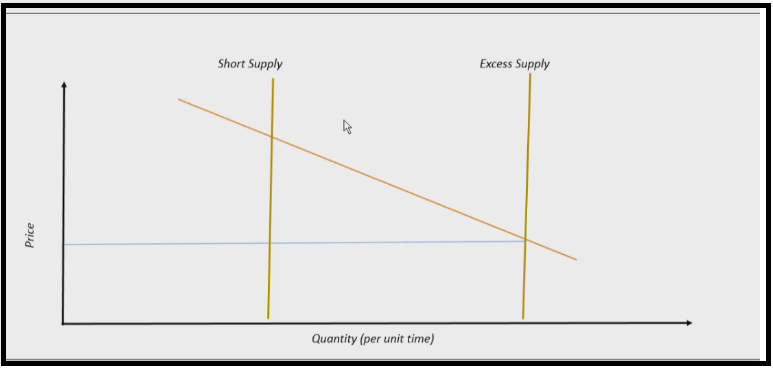
In the figure above, consumption reflects supply and not by the quantity demanded. For example, consumption of ripe mangoes during peak harvest season.
During the summer days, when there was excess supply, mangoes were being sold @Rs. 20/kg in a particular area. In the previous year (2016) the mangoes were selling @Rs. 50/kg in the same area. The consumption was higher in 2017 as compared to the consumption in the year 2016.
But was the quantity demanded any less in 2016? Did the demand for mangoes decrease in 2017 as compared to 2016?
Well the quantity demanded did not change in any of the two year’s, what changed was the supply. The year 2017 was the excess supply year and in the year 2016, the supply of mangoes was limited
This implies that consumption is solely dependent on the supply and will remain the same irrespective of the shift in the demand curve. Thus, the price is the variable that brings the equilibrium.
Increase in consumption will mean a rightward shift in the supply curve a rightward shift in supply is a bearish development.
Can an increase in consumption and a fall in demand happen simultaneously?
In order to understand the above statement, you can watch the video below:
Post our discussion, it is always recommended to consider the factors influencing the demand in our price forecasting analysis. Despite the problem at the quantification level, we should consider the impact of quantity demanded on the prices qualitatively and through model projections.
Hope we have been able to justify the relationship between demand and supply in the most simple manner. In case of any queries, do not forget to comment below.
Visit Stockedge to get various Fundamental and Technical Scans of Financial Markets.
