For making any kind of investments such as bond or equity or other investment instruments, we must also be well aware of the risk and returns associated with that particular investment instrument. Also, we must know about the relation between bond price and yield, calculation of returns, procedure for the determination of prices and practically, we must know the source of all this information.
In this blog, we will clarify the various important concepts on risk and returns associated with the bond, a debt instrument.
| Table of Contents |
|---|
| What is Coupon? |
| What is Current Yield? |
| The relation between bond price and Yield to maturity (YTM) |
| Price determination |
| The basic structure of a bond |
| Practical Aspects |
| Bottomline |
Let us first understand the following:
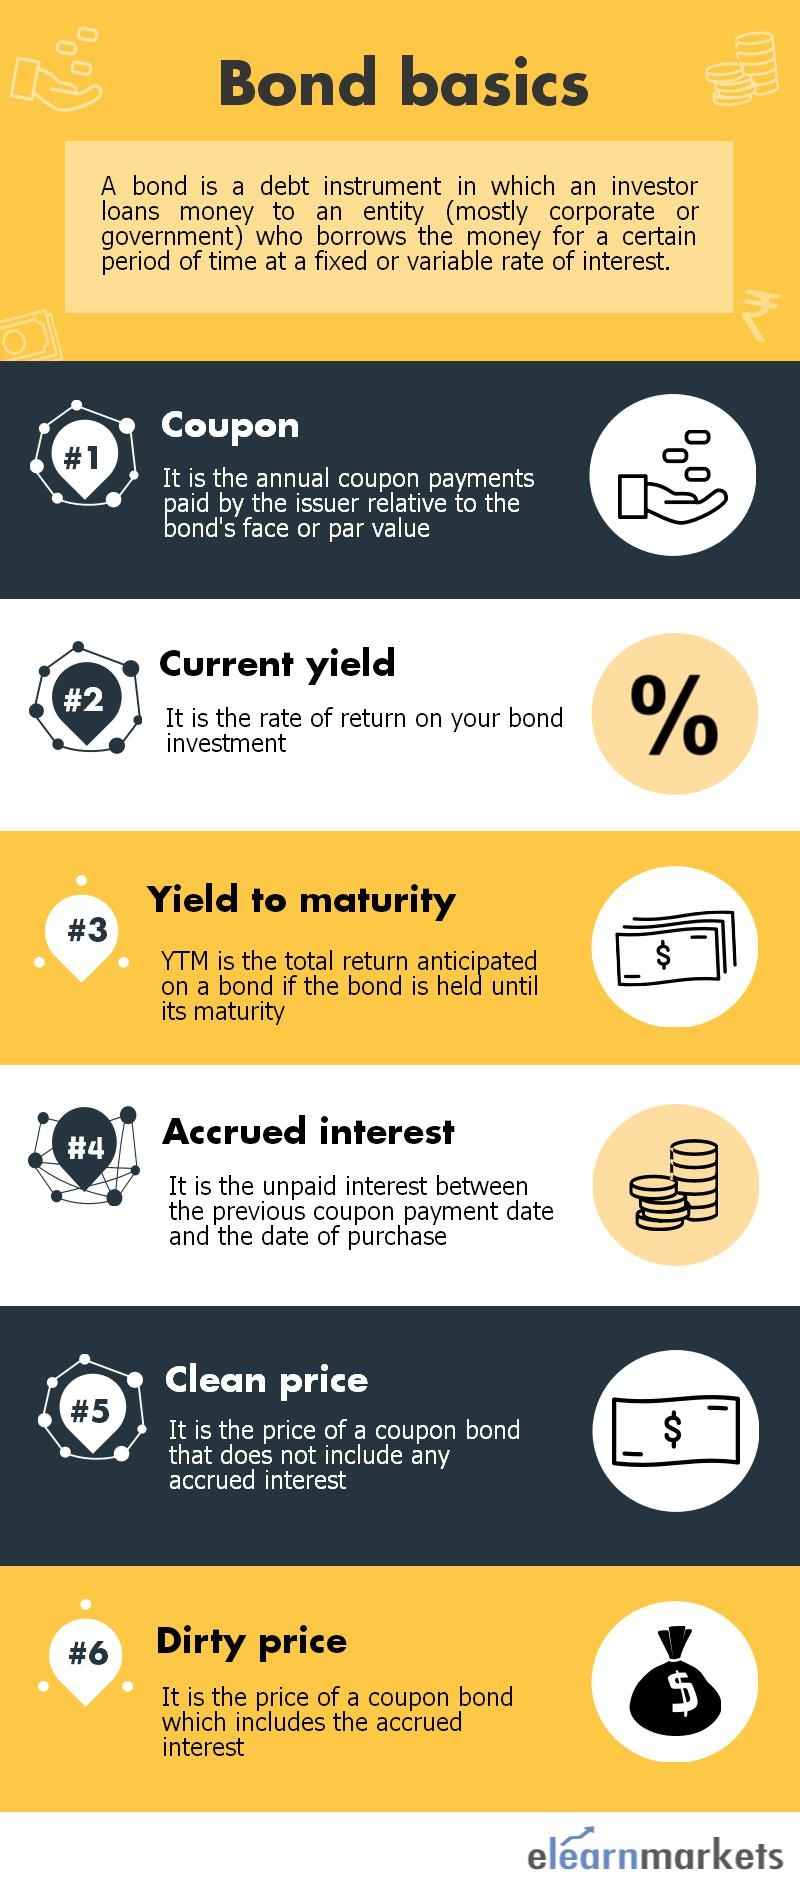
What is Coupon?
Coupon is nothing but the interest or the returns earned from an investment in a bond or debt instrument.
It is the amount paid by the borrower to the lender.
- The borrower has the right to use the money borrowed for a specified period. The coupon amount is paid by the borrower to the lender for this right earned.
- Coupon is expressed as a percentage on the principal amount.
- Principal amount means the amount that has been lent originally by the lender to the borrower and coupon is the percentage of that amount.
- It is denoted on a per annum basis. For example, 772GS8025 means that the coupon rate is 7.72% per annum.
- On the basis of the loan arrangement, the coupon can be paid monthly, quarterly, semi-annually or annually.
While entering into a loan transaction or buying the debt instrument you will come to know whether the instrument is coupon bearing or not.
In case it is, you may receive the coupon/ interest amount periodically, say semi-annually or quarterly, as mentioned above.
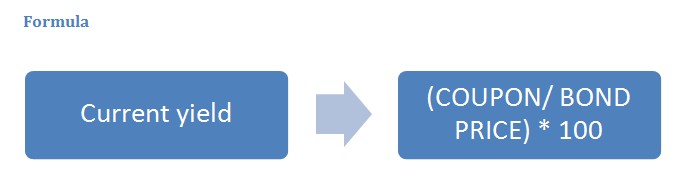
What is Current Yield?
Current Yield is the return/ income earned by the lender from the borrower. It is expressed as the percentage (annual return) based on the investment’s cost, its current market value or the face value.
| COUPON | CURRENT YIELD |
| Coupon amount remains fixed | Current yield changes regularly |
| Coupon only talks about the interest amount. | Current yield also considers the price at which the debt instrument is bought and accordingly, measures the return/ income. |
Formula
Example
Coupon rate = 8%
Face value = Rs. 100/-
This 8% becomes the yield only when the debt instrument is purchased at Rs. 100/-.
However, the price of this instrument will not remain same during the tenure of the instrument. It may fluctuate and may make an upward or a downward move.
In case you have bought the instrument at Rs. 90/-, you will still get Rs. 8 as the coupon amount (Rs. 100/- * 8% = Rs. 8/-). However, your yield, in that case, becomes (8/90 * 100 = 8.89%, which is more than the coupon rate.)
On the other hand, in case you buy the debt instrument at Rs. 110/-, the current yield will be less than the coupon rate (8/110 * 100 = 7.27%)
Note here that you will not buy the instrument always at the face value. Because when you buy the debt instrument from the market, the price can be less or more than the face value or same as the face value.
Your yield or return will depend on the price you pay for the purchase of the debt instrument initially.
This means:
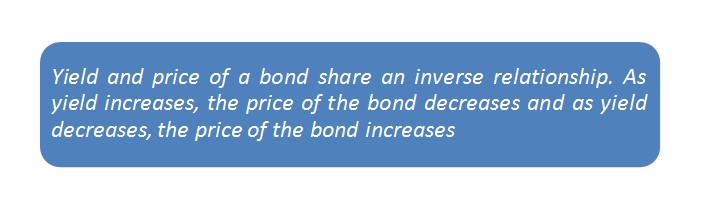
The above relationship between bond price and yield is one of the most important concepts that is used throughout in understanding the other concepts associated with bonds.
The relation between bond price and Yield to maturity (YTM)
YTM is the total return anticipated on a bond if the bond is held until its lifetime. It is considered as a long-term bond yield but is expressed as an annual rate.
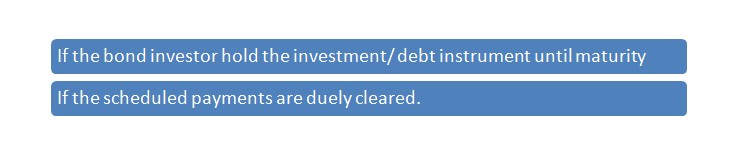
Basically, YTM is the internal rate of return of an investment in the bond if the following two conditions are satisfied:
Also Read: Internal Rate of Return (IRR) explained!
Further, YTM also assumes that the coupon amount earned by you periodically is re-invested in the same debt instrument at the prevailing market prices.
Hence, the calculation of YTM is different from that of the current yield.

YTM is considered as one of the most accurate return measure from an investment in a bond
Price determination
Let us understand as to how bond prices are determined:
Accrued interest
Suppose you have purchased a bond on 31st December, which makes coupon payments, say – semi-annually (31st March & 30th September.)
So when you purchase the bond on 31st December, you also earn three months accrued interest from Oct-Dec.
This unpaid interest between the previous coupon payment date and the date of purchase is called accrued interest.
Accrued interest is the interest that accumulates on a bond between coupon payments
This means that accrued interest is the amount earned and not paid.
This amount will be paid when the coupon payment date is due i.e. 31st March.
In India, it is counted assuming 30 days in a month using 30/360 days.
Example
A 12% coupon bond is trading at Rs. 950 and the last record date for an interest payment was 2 months ago.
Accrued interest for 2 months will be = (coupon/ interest payment for 2 months on face value = 1000 * 12% * 2/12 = Rs. 20/-)
Note: The coupon amount is always paid on face value. Here, face value = Rs. 1000/– and Rs. 950/– is the prevailing market price.
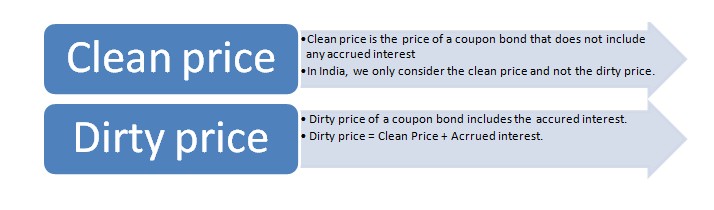
Clean Price and Dirty price
Coupon rate = 8%
Face value = Rs. 100/-
This 8% becomes the yield only when the debt instrument is purchased at Rs. 100/-.
However, the price of this instrument will not remain same during the tenure of the instrument. It may fluctuate and may make an upward or a downward move.
In case you have bought the instrument at Rs. 90/-, you will still get Rs. 8 as the coupon amount (Rs. 100/- * 8% = Rs. 8/-). However, your yield in that case becomes (8/90 * 100 = 8.89%, which is more than the coupon rate.)
On the other hand, in case you buy the debt instrument at Rs. 110/-, the current yield will be less than the coupon rate (8/110 * 100 = 7.27%)
Note here that you will not buy the instrument always at the face value. Because when you buy the debt instrument from the market, the price can be less or more than the face value or same as the face value.
Your yield or return will depend on the price you pay for the purchase of the debt instrument initially.
This means:
The basic structure of a bond
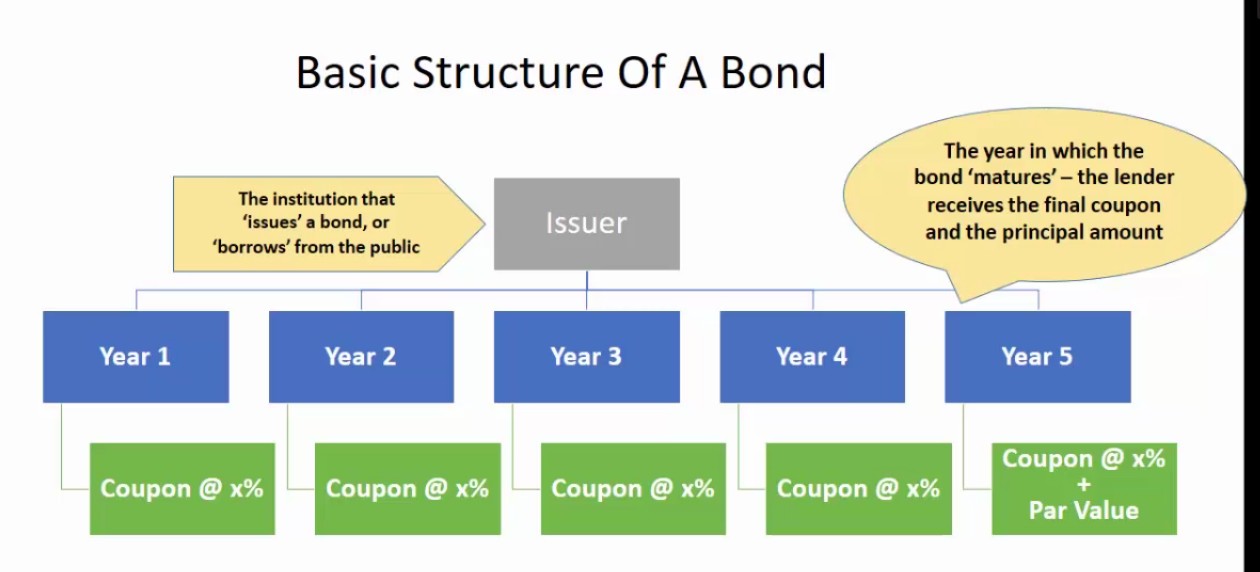
As you can see above, the basic structure of the bond. In case of a bond, there are two parties. One is the issuer and the other one is the lender.
The issuer is the borrower who issues bonds in the market to borrow money from the public.
The lender is the person having surplus cash, who invests in the debt instrument.
Suppose the above-mentioned bond that we are talking about has a maturity period of 5 years.
Now the borrower/ issuer will pay x% of coupon amount to the lender as per the payment schedule.
On the final year, the lender not only receives the coupon amount but also the final repayment of the amount lend or the principal amount.
Practical Aspects
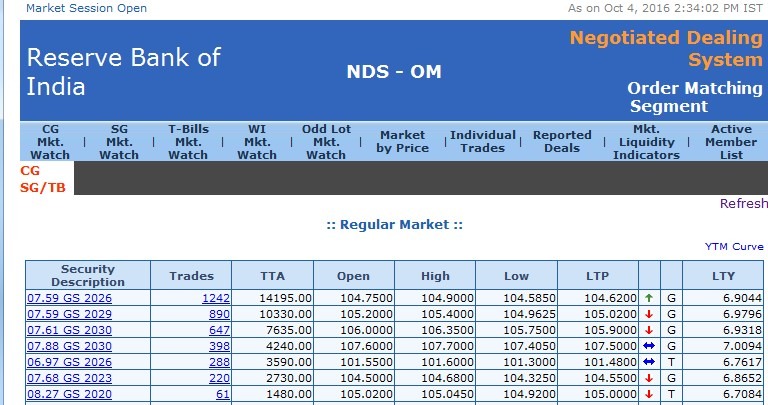
Let us understand how to see the prices of the bond in the underlying market.
- Click on the website. This is the market where the underlying bonds are traded.
- If you want to see the details of the underlying bond, you need to click on the highlighted portion below-
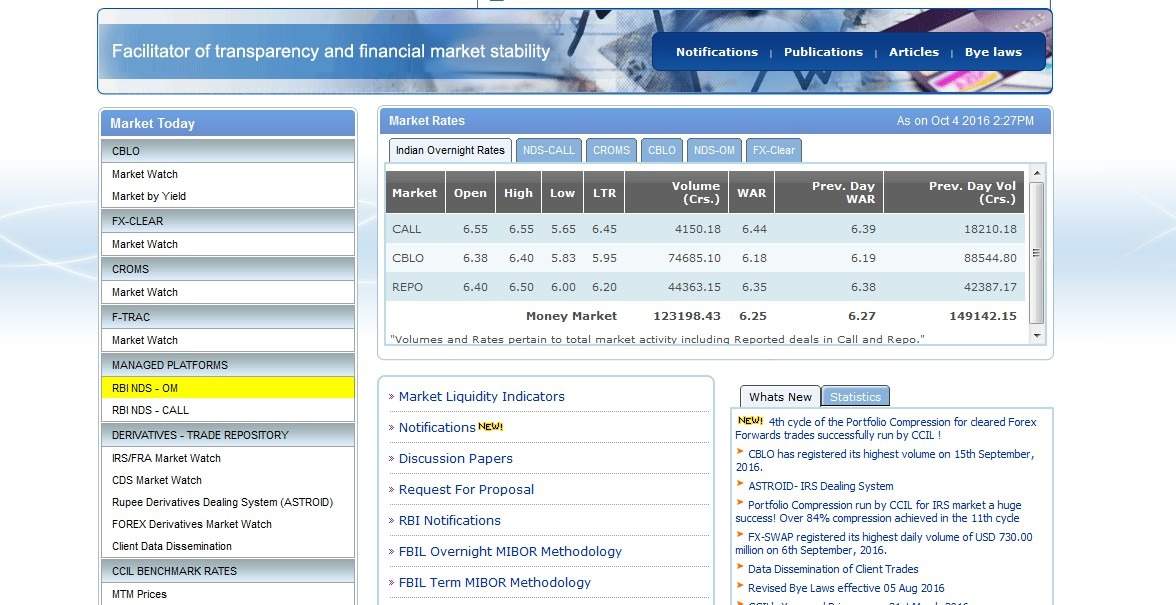
Once you click on the above-highlighted portion, you will find a screen appearing showing you all the details of the bond, as shown below:
Now suppose you wish to see the yields of the exchange-traded futures.
- For this you need to visit the website. It is National Stock Exchange of India website.
- Choose the section live markets and among the options available, choose NSE bond futures.
- You will find all the details about the bond futures required.
Bottomline:
The relationship between the bond price and yield plays an important role in the understanding of the other concepts associated with fixed investment instruments.
Thus, it is imperative to have a clear understanding of this relationship.
Feel free to write back to us in the comment box below.


Although bonds are considered safe, there are pitfalls like interest rate risk—one of the primary risks associated with the bond market. Reinvestment risk means a bond or future cash flows will need to be reinvested in a security with a lower yield.
A bond’s nominal yield, depicted as a percentage, is calculated by dividing all the annual interest payments by the face value of the bond.
Great write-up, I’m normal visitor of one’s website, maintain up the excellent operate, and It is going to be a regular visitor for a lengthy time.