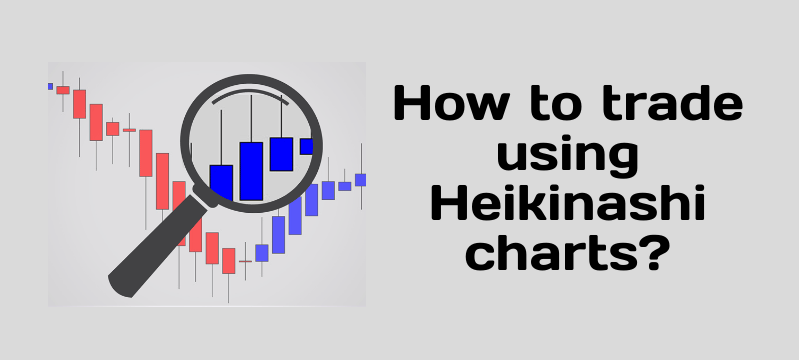
Heikin Ashi candlestick is a unique charting method which gets attached to your standard price chart.
The chart will resemble as that of a Japanese Candlestick chart, however, there are various points that make reading the Heikin Ashi candles a bit different than the traditional candlestick chart.
The main difference between normal candlestick and Heikin Ashi charts is that the Heiken Ashi charts average price moves, creating a smoother appearance. Because the Heiken Ashi price bars are averaged, they don’t show the exact open and close prices for a particular time period.
| Table of Contents |
|---|
| Heikin Ashi Candlestick Calculation |
| How to use Heikin ashi candlestick charts? |
| How to Interpret Heikin Ashi Candlestick |
| How to identify trend reversal? |
| Bottom Line |
Heikin Ashi charts simply calculate their own Open, High, Low and Close using the Actual Open (O), High (H), Low (L) and Close (C) of various time frames (1 minute, 5 minutes, 15 minute, etc.).
Heikin Ashi Candlestick Calculation
HAO = (Open of previous bar + Close of previous bar) / 2
HAC = (Open + High + Low + Close) / 4
HAH = Highest of High, Open, or Close
HAL = Lowest of Low, Open, or Close
A mathematical formula is there for the calculation of each price bar on a Heikin Ashi chart so you don’t know the exact price a time period opened or closed it.
For a day trader, this may be an issue, since knowing the exact price, especially when trading off a chart is important.
Learn Trend Following with Heikin Ashi Candlesticks in just 2 hours from Market Experts
For longer-term traders, this might not be a problem, since the open and close of a price bar are not as important since it lasts for several months or even years.
Want to know more about Heiken Ashi charting? Watch the video below:
How to use Heikin ashi candlestick charts?
If your goal is to catch longer and persistent trends, then using a Heikin Ashi chart will help you toward that end.
Trend detection is one of the main functions of this type of charting style.
The Heikin Ashi trading style puts an emphasis on persistent trends.
Small corrections and consolidations are filtered and they are barely visible on the chart.
You will notice that when the direction changes on a Heikin Ashi graph, the price most likely starts a new move.
This helps to distinguish between the potential beginning and the end of a stock.
Since chart noise is filtered, you basically see the naked trend.
Using a trailing stop is a good trade management tool to pursue in a trending market.
As a result, many traders combine the soothing benefits of the Heikin Ashi chart with a trailing stop indicator to get the most of out a trending market condition.
Another way to use a Heiken Ashi graph is to look for chart patterns like triangle and flag pattern and apply price action rules.
In most cases, this works the same way as with traditional Japanese candlesticks.
But you will find that Heiken Ashi chart pattern breakouts are sometimes more reliable than traditional candlestick charts.
How to Interpret Heikin Ashi Candlestick
Heikin-Ashi charts help traders view trends and spot potential reversals.
Therefore, they are most applicable to trend traders.
The HA candles change dramatically in appearance when a strong trending move is underway relative to pullbacks.
Upward trending moves typically have long upward candles with very little or no lower shadows.
The shadows are the thin lines that extend out from either side of the fat part of the candle – called the real body.
These shadows represent the maximums and minimums of the Low, Open, Close and High.
When a strong uptrend is underway, and the buying is aggressive, the lower shadows (sticking out the bottom of the real bodies) will not typically appear.
During pullbacks or weak trending moves, there are red bars as well with lower shadows. This doesn’t necessarily indicate a reversal, but it does mean the trend is in a corrective phase or slowing.
How to identify trend reversal?
To spot reversals or trend continuations there needs to be a breakout or a major shift in price just like what is required with traditional charts.
Using what we know about strong trending moves and weak trending moves from above, combine it with other technical analysis concepts, such as trendline breaks, to spot reversals.
Bottom Line
Heikin Ashi charts appeal to traders because trends are easier to spot and the way the bars are calculated creates a smoother appearance.
Traditional forms of technical analysis and chart patterns can still be used and traded with Heiken Ashi. Long up bars with no lower shadows or long down bars with no upper shadows signify strong up and down trends respectively.
Trading on Heikin Ashi charts is similar to trading on other charts. Focus on trading in the direction of the overall trend.
Use Heikin Ashi price bar characteristics to determine trend strength, when the trend is slowing down and apply other technical analysis concepts (such as trend lines) to isolate major price reversals.
In order to get the latest updates on Financial Markets visit https://stockedge.com/


I do enjoy the way you have presented this particular challenge and it does indeed give us a lot of fodder for thought. Nevertheless, from just what I have personally seen, I just trust as the reviews pile on that men and women stay on issue and in no way get started on a tirade associated with some other news du jour. Still, thank you for this fantastic point and whilst I can not go along with the idea in totality, I value your standpoint.