Elearnmarkets - Financial Market Learning
  • Courses
  • Webinars
  • Stories
  • Language
    • English
    • Hindi
    • Bengali
No Result
View All Result
Get Free Course
  • Basic Finance
  • Derivatives
    • Futures
    • Options
  • Financial Planning
  • Fundamental Analysis
  • Technical Analysis
  • Mutual Funds
  • Marketshala
  • Miscellaneous
Elearnmarkets - Learn Stock Market, trading, investing for Free
  • Courses
  • Webinars
  • Stories
  • Language
    • English
    • Hindi
    • Bengali
No Result
View All Result
Get Free Course
Elearnmarkets - Learn Stock Market, trading, investing for Free
No Result
View All Result
Home Technical Analysis
Pennants Pattern - Formation, Trading and how it is different from Wedges 1

Pennants Pattern – Formation, Trading and how it is different from Wedges

Elearnmarkets by Elearnmarkets
November 25, 2024
in Technical Analysis, Charts, Patterns & Indicators
Reading Time: 7 mins read
0
18.1k
VIEWS
Share on FacebookShare on XShare on WhatsApp

Pennants pattern are a type of continuation chart pattern.

Pennants are similar to flag chart patterns in the terms that they have converging lines during their consolidation period.

This chart pattern takes one to three weeks to form.

A large movement in the stock’s prices is observed after which there is a consolidation phase and then there is the continuation of the existing trend.

Table of Contents
What is the Pennant chart pattern?
Formation of Pennants Pattern
Trading with Pennant Pattern
Example of Pennant Pattern
Difference between Pennants and Wedges
Key Takeaways

In this blog let us discuss the formation of the pennant chart pattern and how to trade with this chart pattern:

What is the Pennant chart pattern?

Pennants are continuation patterns in which a large movement in the stock’s prices is observed after which there is a consolidation phase and then the continuation of the existing trend.

The large movement in the prices is known as the flagpole.

This indicates a sharp movement in the prices.

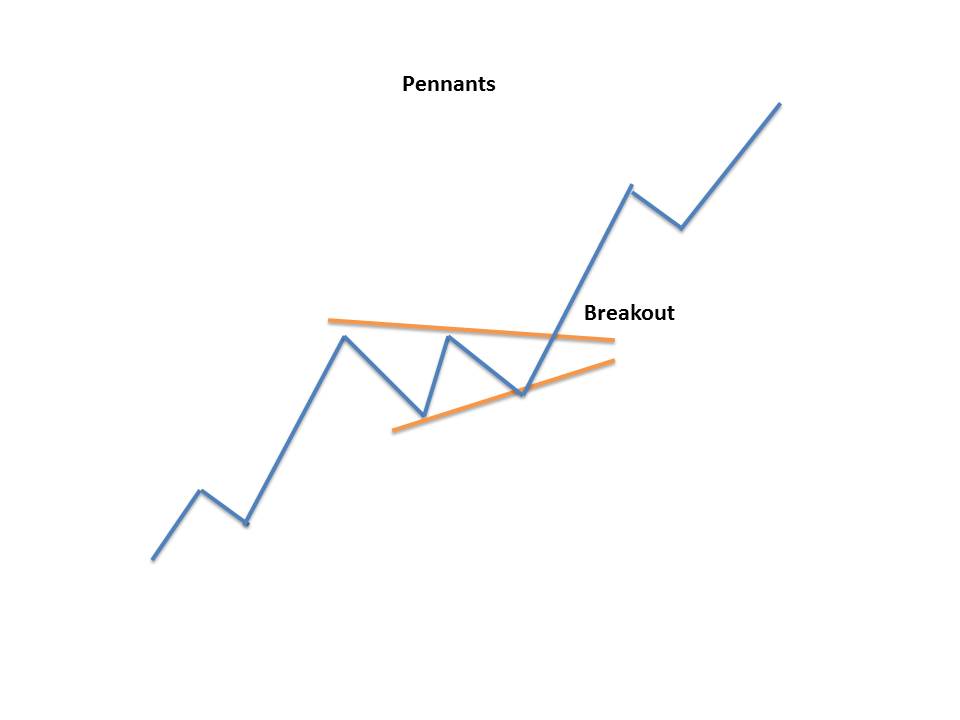
When identifying a consolidation phase traders should look for two converging lines.

After the consolidation phase, the breakout of the prices takes place in the same direction as the prior trend.

The breakout of the prices is usually accompanied by an increase in the volume.

Pennants can be of two types:

1. Bullish Pennants:

A bullish pennants pattern is formed after a sharp rise in the prices of the stock.

After a long uptrend, traders try to close their position with the assumption that reversal is going to come.

The prices began to consolidate as the traders start exiting the stock.

But at the same time, new buyers start buying the stock which results in the breakout of the prices in the same direction as the prior uptrend.

Learn to Identify Trend Reversals with Candlesticks in just 2 hours by Market Experts

2. Bearish Pennants:

A bearish pennants pattern is formed after a sharp fall in the prices of the stock.

After a long downtrend, traders try to close their sell position with the assumption that reversal is going to come.

The prices began to consolidate as the traders start exiting the stock.

But at the same time, new sellers start the shoals pharmacy.com selling the stock which results in the breakout of the prices in the same direction as the prior downtrend.

Formation of Pennants Pattern:

Here is the formation of the pennant chart pattern:

Pennants Pattern Formation

Trading with Pennants Pattern:

When trading with the Pennants pattern, the following points need to be noted:

  • After a strong movement either uptrend or downtrend, the prices should move in a consolidation phase.
  • The volume should increase in the initial move of this pattern formation followed by the weakening of the volume and then increase in the volume at the breakout.
  • The prices should move in the prior direction after the breakout.
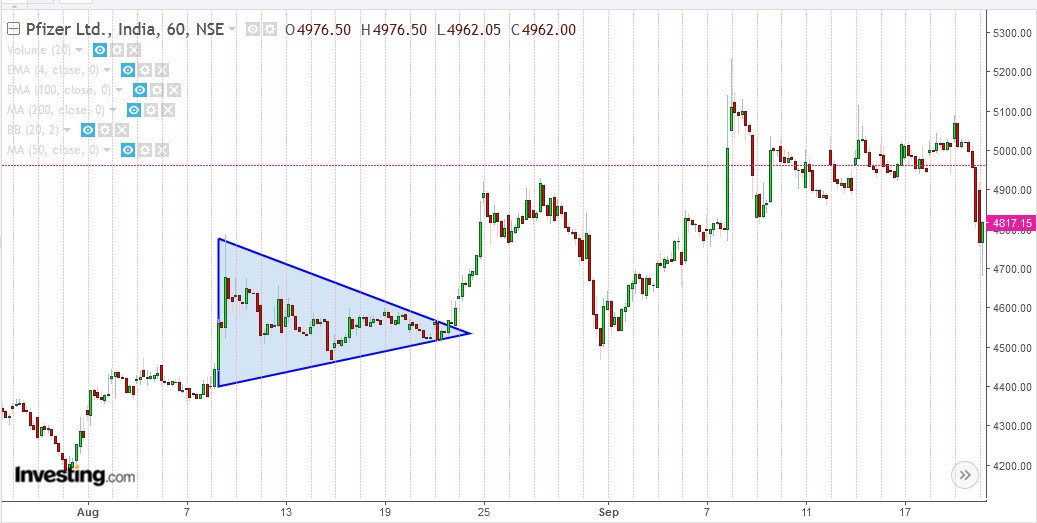
Example:

We can see the formation of Pennants Pattern in the hourly chart of Pfizer Ltd.

After an uptrend, the prices moved in the consolidation phase forming a pennant and the prices continue to move in an uptrend after the breakout.

Pfizer Pennants Chart

Stop Loss:

The stop-loss level is set at the lowest point of the pennant pattern.

Price Target:

The price target for pennants is set by measuring the initial flagpole’s height to the point at which the price breaks out from the pennant.

Difference between Pennants and Wedges:

Pennants and wedges as both continuation patterns.

They look like triangles but they are smaller.

The main difference between pennants and wedge patterns is pennants are sideways and horizontal.

Whereas the wedges are either ascending or descending.

Frequently Asked Questions

What does a pennant look like?

Pennants are similar to flag chart patterns in the terms that they have converging lines during their consolidation period. A large movement in the stock’s prices is observed after which there is a consolidation phase and then there is the continuation of the existing trend.

What is the difference between a flag and a pennant?

The pennant pattern is identical to the flag pattern the only difference is that the consolidation phase of a pennant pattern is characterized by converging trend lines rather than parallel trend lines.

What is a bullish pennant?

A bullish pennants pattern is formed after a sharp rise in the prices of the stock.

What is a bearish pennant?

A bearish pennants pattern is formed after a sharp fall in the prices of the stock.

Key Takeaways:

  • Pennants are a type of continuation chart pattern.
  • Pennants can be bullish or bearish depending on the trend they are formed.
  • Pennants are similar to flag chart patterns in the terms that they have converging lines during their consolidation period.
  • Pennants and wedges are both continuation patterns but there is a difference between them.

Happy Learning!

Tags: bearish pennant PatternBullish pennant Patternchart patternpennantstechnical basics
ShareTweetSend
Get Kotak Offer Get Kotak Offer Get Kotak Offer
Previous Post

Fundamental Analysis of A Company – Importance, Advantages & Example

Next Post

Channel Chart Pattern – Formation, Types, and Trading

Elearnmarkets

Elearnmarkets

Elearnmarkets (ELM) is a complete financial market portal where the market experts have taken the onus to spread financial education. ELM constantly experiments with new education methodologies and technologies to make financial education effective, affordable and accessible to all. You can connect with us on Twitter @elearnmarkets.

Related Posts

Understand Slippage in Trading
Technical Analysis

What is Slippage in Trading? Meaning & Examples

March 28, 2025
357
Breakout trading strategies
Technical Analysis

Top 5 Breakout Trading Strategies

March 12, 2025
1.3k
5 stocks for today
Technical Analysis

5 Stocks to Buy Today That Could Beat the NIFTY in 2025!

May 5, 2025
449
Image describing What is marginal trading facility
Technical Analysis

 What is a Margin Trading Facility? Advantages & Risks

April 4, 2025
857

Leave a Reply Cancel reply

Your email address will not be published. Required fields are marked *

Disclaimer

Elearnmarkets (Kredent InfoEdge Pvt. Ltd.) is a SEBI-registered Research Analyst (RA) entity (SEBI Registration No.: INH300007493). The information provided in this article is for educational and informational purposes only and should not be considered as an offer to buy or sell any securities or investment products.

The stocks, securities, and investment instruments mentioned herein are not recommendations under SEBI (Research Analysts) Regulations, 2014. Readers are advised to conduct their own due diligence and seek independent financial advice before making any investment decisions.

Investments in securities markets are subject to market risks. Please read all related documents carefully before investing. Investing in Equity Shares,
Derivatives, Mutual Funds, or other instruments carry inherent risks, including potential loss of capital. Elearnmarkets (Kredent InfoEdge Pvt. Ltd.) does not provide any guarantee or assurance of returns on any investments. Past performance is not indicative of future performance.

Elearnmarkets Logo

Follow Us

Facebook-f X-twitter Instagram Linkedin-in Youtube Telegram

Register on Elearnmarkets

Continue your financial learning by creating your own account on Elearnmarkets.com

Register Free Account

Download App

Playstore logo
Download on app store

Categories

  • Basic Finance
  • Derivatives
  • Financial Planning
  • Fundamental Analysis
  • Technical Analysis
  • Mutual Funds
  • Miscellaneous

Popular On Elearnmarkets

  • Market Superheroes:
  • Vivek Bajaj
  • Chetan Panchamia
  • Ashish Kyal
  • Premal Parekh
  • Abhijit Paul
  • Jegan
  • Sivakumar Jayachadran
  • Jyoti Budhia
  • Vivek Gadodia
  • Vishal Mehta
  • Piyush Chaudhry
  • Santosh Pasi
  • Gomathi Shankar
  • Market Superheroes:
  • Vivek Bajaj
  • Chetan Panchamia
  • Ashish Kyal
  • Premal Parekh
  • Abhijit Paul
  • Jegan
  • Sivakumar Jayachadran
  • Jyoti Budhia
  • Vivek Gadodia
  • Vishal Mehta
  • Piyush Chaudhry
  • Santosh Pasi
  • Gomathi Shankar
  • Courses:​
  • Options Trading
  • Dow Theory
  • Momentum Trading
  • Stock Investing
  • Harmonic Chart Patterns
  • Algo Trading
  • Elliot Wave Theory
  • Advanced Excel
  • Cryptocurrency
  • NSE Certification Course
  • Courses:​
  • Options Trading
  • Dow Theory
  • Momentum Trading
  • Stock Investing
  • Harmonic Chart Patterns
  • Algo Trading
  • Elliot Wave Theory
  • Advanced Excel
  • Cryptocurrency
  • NSE Certification Course
  • Webinars:
  • Bank Nifty Scalping
  • Intraday Trading Strategies
  • Options Trading Strategies
  • Options selling
  • Price Action
  • Relative Strength
  • Tax Planning
  • Options Buying
  • Growth Stocks
  • Portfolio Management
  • Risk Management
  • Renko Charts
  • Crude Oil
  • Traders Psychology
  • Moving Average
  • Multibagger Stocks
  • Free Learning Modules:
  • Intraday Trading
  • Options Scalping
  • Swing Trading
  • Financial Modelling
  • RSI Indicator
  • Bollinger Bands
  • Pricing of Futures
  • Personal Finance
  • Initial Public Offerings (IPO)
  • Value Investing
  • Technical Indicators
  • Candlesticks
  • Chart Patterns
  • Option Greeks
  • ELSS Funds
  • Banking and Insurance
  • Real Estate
  • Gold
  • Book Summaries:
  • Rich Dad Poor Dad
  • Psychology of Money
  • The Intelligent Investor
  • The Richest Man in Babylon
  • Think and Trade Like a Champion
  • Value Investing and Behavioural Finance
  • Trading in the Zone
  • Learn to Earn
  • Book Summaries:
  • Rich Dad Poor Dad
  • Psychology of Money
  • The Intelligent Investor
  • The Richest Man in Babylon
  • Think and Trade Like a Champion
  • Value Investing and Behavioural Finance
  • Trading in the Zone
  • Learn to Earn
  • Tools:
  • CAGR Calculator
  • SIP Calculator
  • eLearnOptions
  • Future Value Calculator
  • Present Value Calculator
  • Atal Pension Yojana
  • Cost of Delay Calculator
  • Become a Crorepati
  • Tools:
  • CAGR Calculator
  • SIP Calculator
  • eLearnOptions
  • Future Value Calculator
  • Present Value Calculator
  • Atal Pension Yojana
  • Cost of Delay Calculator
  • Become a Crorepati

© 2025 Elearnmarkets. All Rights Reserved

  • Visit Elearnmarkets
  • Courses
  • Webinars
  • Financial Guides
  • Get Free Counselling
  • Visit Elearnmarkets
  • Courses
  • Webinars
  • Financial Guides
  • Get Free Counselling

Download Our App

No Result
View All Result
  • Article Categories
    • Basic Finance
    • Derivatives
    • Financial Planning
    • Fundamental Analysis
    • Technical Analysis
    • ETFs & Mutual Funds
    • Marketshala
    • Miscellaneous
  • Language
    • Hindi
    • Bengali
    • English
  • Courses
  • Webinars
  • Stories
Get Free Course

© 2024 Elearnmarkets All Rights Reserved

A Handbook of Technical Analysis
To start your trading journey as a seasoned technical analyst
Download Guide For FREE
Guidebook On Chart Patterns
Take Your Trading To The Next Level With Strategies Shared In This Ebook
Download Guide For FREE
How to Spot False Dips and Trade with Confidence