Open Interest defines the total number of open or outstanding contracts presently held by the market participant at a given time. Open Interest analysis helps in the identification of stock market trends.
In simple language, this analysis helps a trader to understand the market scenario by only showing a number of futures contracts that have been changed hand during the market hours. Open Interest analysis is mostly used by Future and options contract traders. Open Interest data changes day by day depending on the outstanding contracts.
- What is Open Interest?
- Importance Of Open Interest Data
- Factors Affecting Open Interest
- How do we analyze open interest data for identifying trends?
- How to find open interest in stocks?
- Strategies For Utilising Open-Interest Data
- How to read open Interest data using StockEdge?
- Frequently Asked Questions
- Bottom line:
What is Open Interest?
Let’s take an example to understand the whole picture.
There are four participants in the market A, B, C, D, and E.
So, we can understand how OI changes depending on the change in hand of contracts.
Hence,
- When a new entrant trades with a new entrant in F&O market OI goes up
- When an existing position holder squares off with entry of a new entrant, OI remains unchanged
- When two existing position holders square off their positions we see OI go down
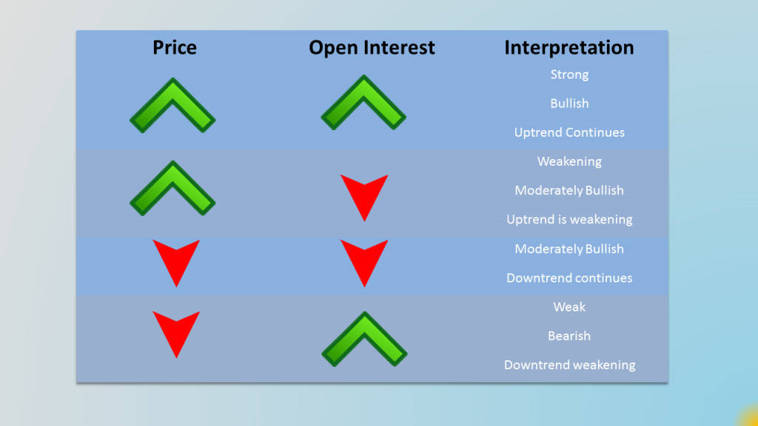
Have a look on basic OI Analysis:
Importance Of Open Interest Data
OI is the total number of outstanding contracts that market players hold at the conclusion of each trading day. It offers perceptions of market expectations and investor mood. Growing OI indicates fresh capital entering the market, which, depending on whether the market is increasing or dropping, indicates a growing bullish or bearish mood.
High market liquidity is usually correlated with high OI. More players are actively trading in a liquid market with high OI, which facilitates entry and exit of positions without appreciably impacting prices.
The strength or weakness of a price trend can be verified by changes. For instance, rising prices and increased OI may indicate that fresh money is entering the market to support the upswing. On the other hand, a rise in price combined with a fall in OI may suggest that the trend is losing steam.
Factors Affecting Open Interest
Open interest rises when traders take up new positions through the purchase of contracts (long positions) or the sale of contracts (short positions). This illustrates the state of the market and interest in the particular contract.
Final Positions: On the other hand, open interest falls as traders settle their current positions (by covering short positions or selling long positions).
How do we analyze open interest data for identifying trends?
A trend can be defined by price movement upward or downward, but its sustainability is questionable. Some important factors back up the price’s decision to take a certain direction. OI data is one of these factors and a reason for a sustainable trend as well as a trend reversal.
Role of Open Interest in Market Sentiment
When the price is going up or down, and the future OI increases alongside the price at a certain level, then we can expect that the price movement is going to be sustained. On the other hand, when a trend is present in the market and a sudden fall in future OI is visible, then we should be doubtful about the trend. There is a chance of trend reversal.
OI increasing means fresh money is flowing into the market, while a decrease in OI suggests money outflow from the market. Buyers move the market up by investing fresh cash into it, while sellers do the opposite. Oi increases when the fresh contract exchanges hands.
Combining Open Interest with Price Movements
A trend depends on how many fresh contracts is exchanging hands with the new price move. If the fresh cash does not flow into the market and the fresh contract does not exchange hands, then we should be doubtful about the trend. Learn how to calculate open interest.
How to find open interest in stocks?
There are multiple sources where we can find out the OI of a stock. The most reliable source is NSE OI , this is the site of the National Stock exchange (NSE). You will find out the last day’s OI as shown in the picture. However, data are updated at the end of the day (EOD).
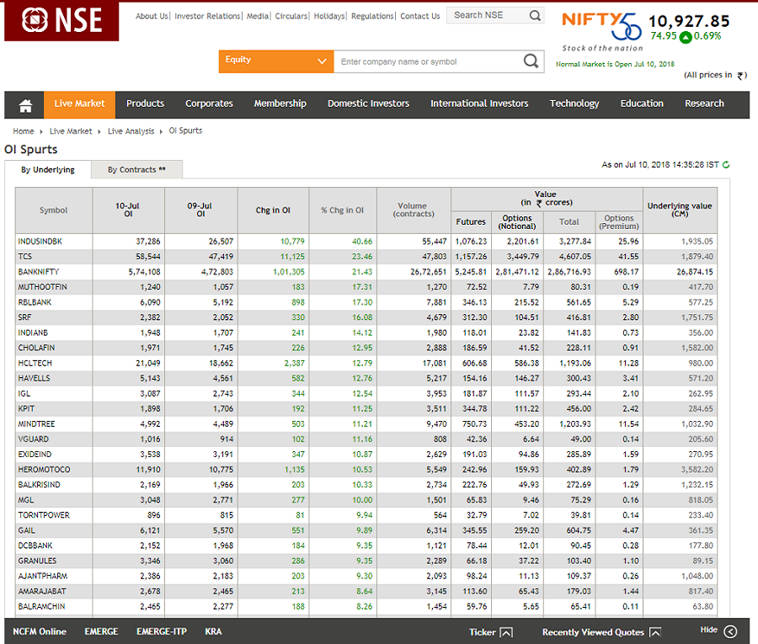
This data can help us invest in or trade futures contracts. There is another way to find open interest, and this is especially true for options traders.
Strategies For Utilising Open-Interest Data
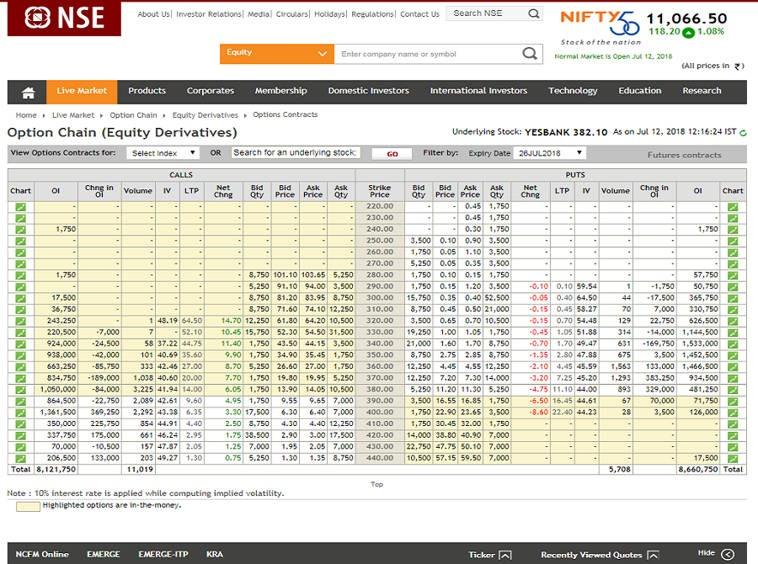
The option Chain of any stock gives us a great understanding of how the bulls and bears are placed in the markets. Normally, bulls participate by selling put options, and bears participate by selling calls.
We must understand one important point: Due to options’ inherent time decay, there are generally a large number of option sellers in the market. A large number of option OI at any particular strike price is the point of significance. Learn the strategy using option open interest
Open Interest Analysis for Short Term Trading
If there is a significant gap-up or gap-down opening in the market contrary to the build-up of OI, then the unwinding of the OI pushes the market more in a gap-up /gap-down direction due to the sheer urgency of short covering. The sharper the gap-up or gap-down, generally, the more impactful the follow-up short covering of options in that particular direction.
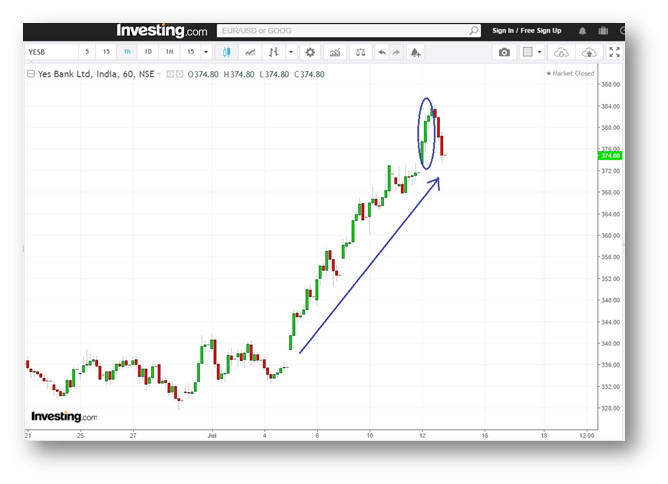
Let us look at the example of Yes Bank. The stock had already been on an up-trend. However, there was a fair amount of call writing at 370, 380, and 400 strike prices.
As Yes Bank opened the gap up there was a good amount of short covering at 370 and 380 calls. Simultaneously there were strong put additions in 360, 370, and 380 strike prices. That pushed the stock even higher during the initial phase of the day.

Long-Term Investing with OI
It’s crucial to understand that open interest (OI) data is largely utilized in derivatives markets, such as futures and options, to measure short-term market mood and activity, when evaluating long-term investing strategies. The direct application of OI, however, might be less significant for long-term investors who are mostly focused on conventional equities investment.
How to read open Interest data using StockEdge?
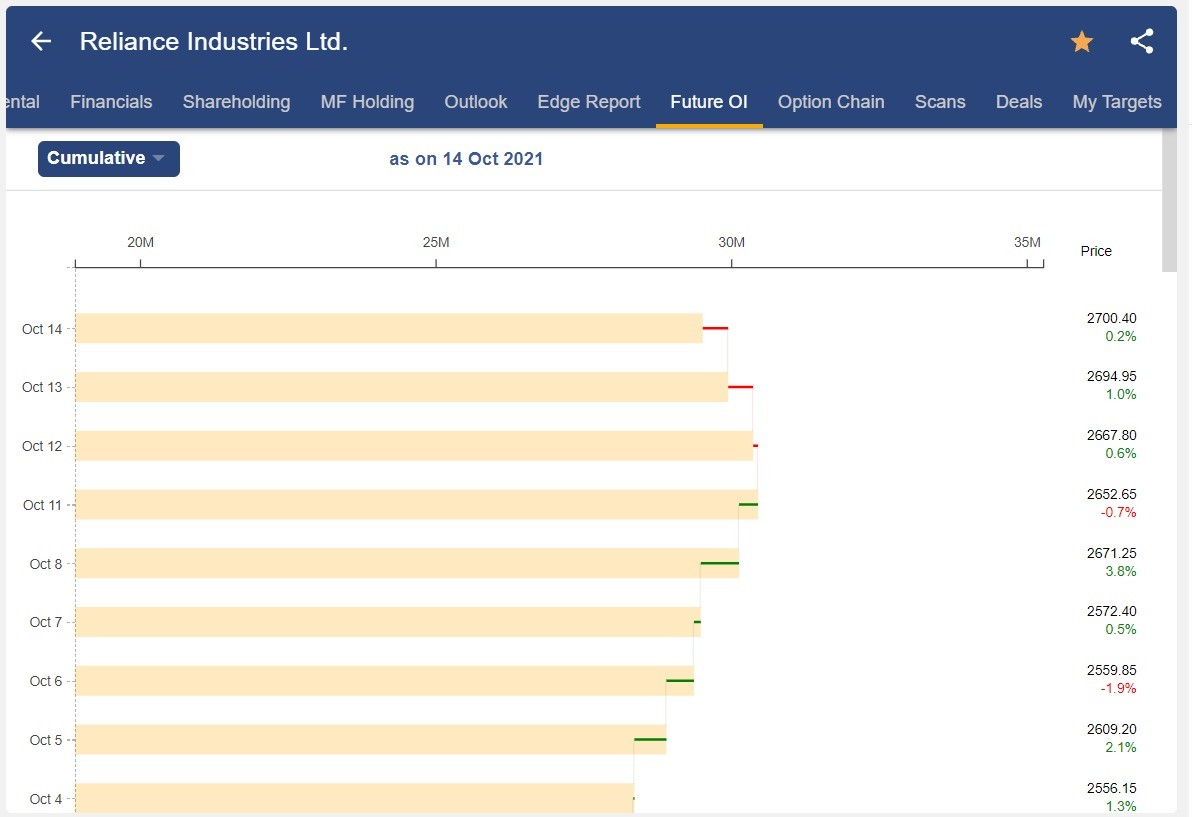
StockEdge has an open interest analysis tool. It also provides OI data at the end of the day (EOD).
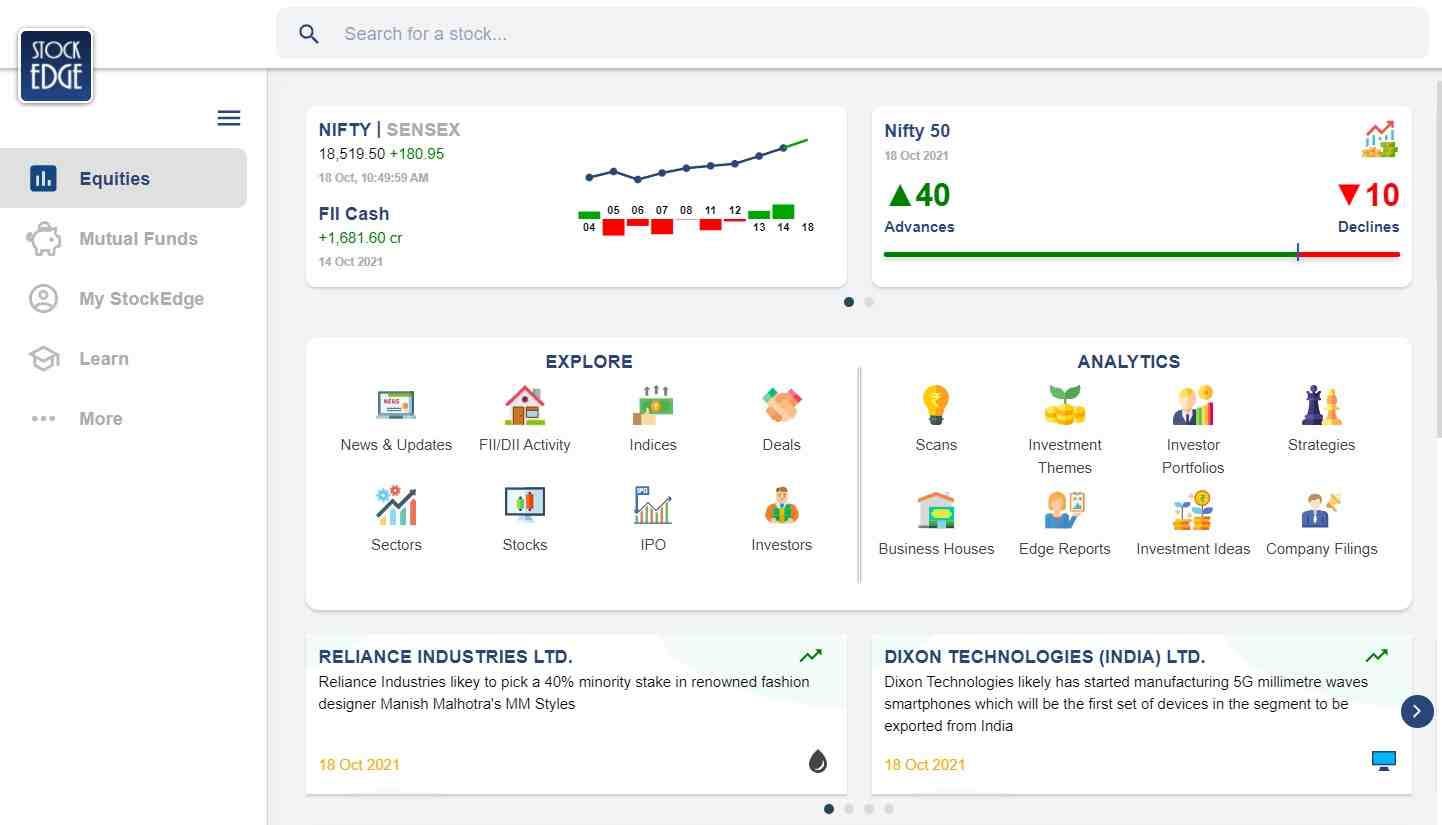
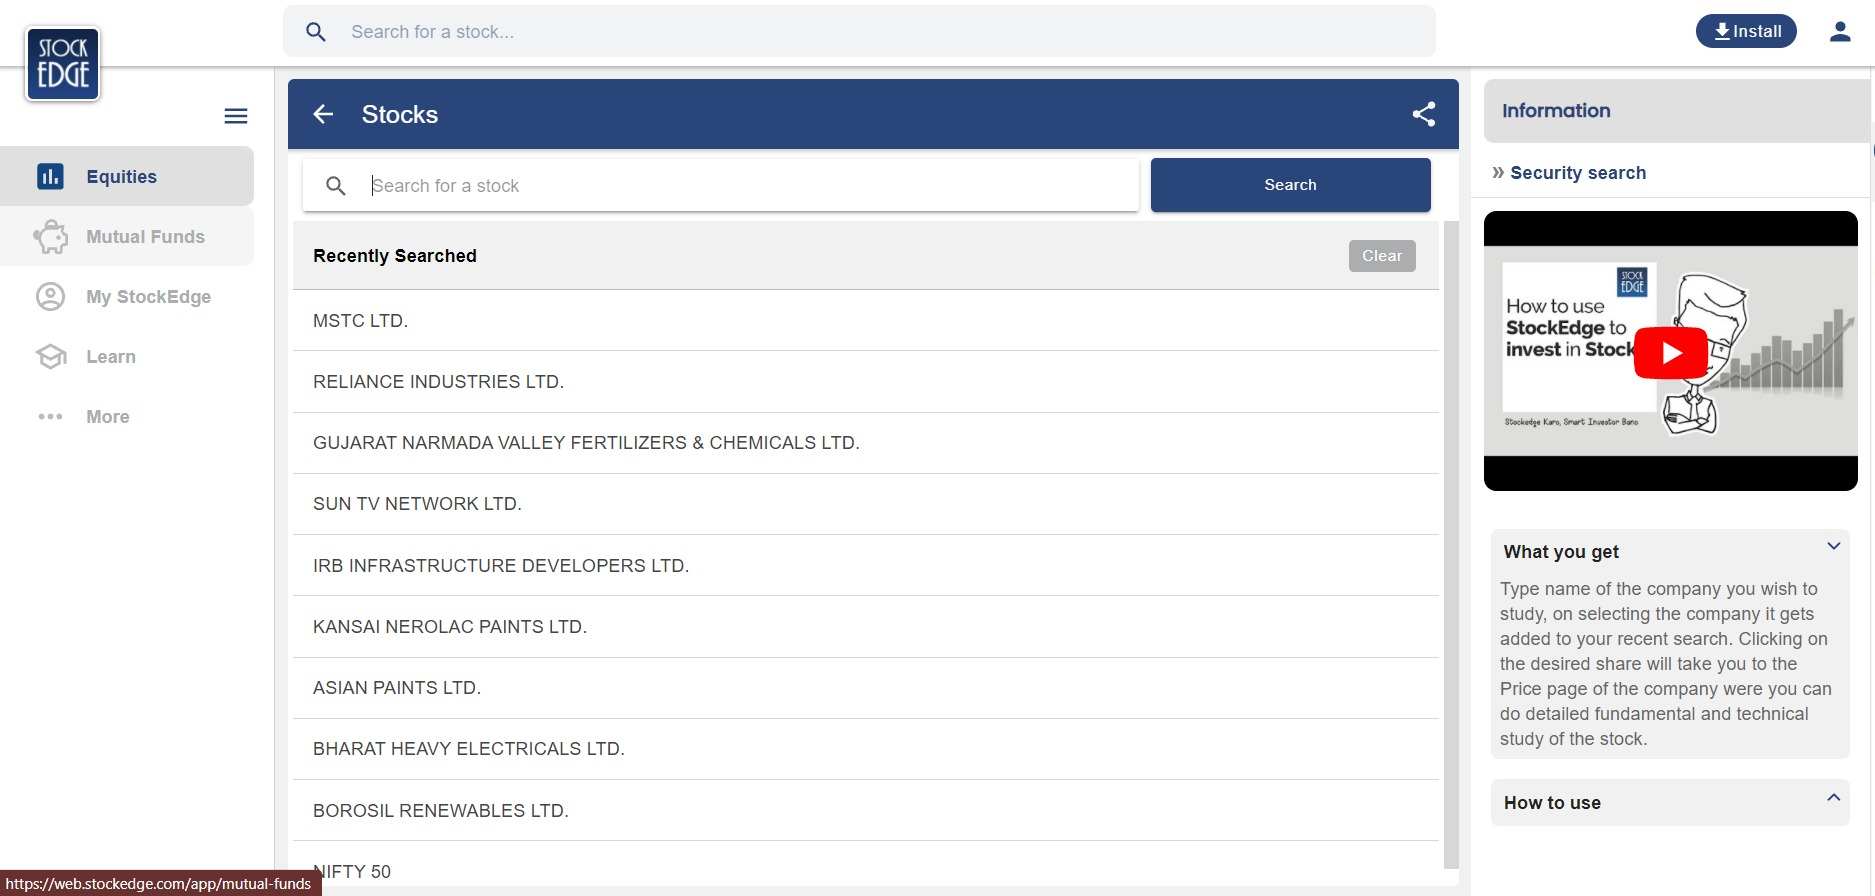
Finding the Open Interest in the StockEdge application is really easy. Just tap on the ‘stocks’ button from the home tab. Type the name of the stock in the search bar (remember the stock has to be listed in the Future and Options segment) and check its OI.
You can also watch the video below on Open Interest:
There are also many more exciting features available in the StockEdge app. From learning about the stock market to investing in stocks, this app accomplishes each and every requirement related to the market.
Suggested Read – How to use Open Interest to increase profitability.
Frequently Asked Questions
What does open interest indicate?
The open interest analysis helps a trader to understand the market scenario by only showing a number of futures contracts that have been changed hand during the market hours.
What is the difference between open interest and volume?
Volume refers to the number of contracts that have been traded in a given period, and open interest indicates the number of contracts that are active, or not settled.
What is the use of open interest?
The open interest helps in understanding whether the trend of the stock will continue or reverse.
Should open interest considered while trading in options?
Yes the open interest should be definitely considered while trading in options.
Bottom line:
Open Interest data analysis should be done as a supportive tool along with technical analysis. It is important to look on them both at the end of the day and during the day. For stocks which are in F&O segment high open interest build-up in futures and options are good indication of market direction.
This is not a straight forward tool though and requires experience to judge the role of open interest build-up at various stages of any expiry. So to master the art, we suggest traders and investors to study the open interests of stocks with regularity and discipline.


sir
plz tell me the detailed information about OPEN INTEREST (OI) ,i can’t understand even i read that.
can you show me in charts how it working .
Hi,
You can read more about open interest blogs here.
Thank you for reading!
Really nice article. Good amount of information is given. Thanks.
Sir why there is a difference between change in OI and volume data for a particular strike price in a day as increase in OI and volume seems have to be referring same data in a trading day. In option chain we find that there is huge difference between these two data : some times volume is very low and increase in OI is very high while some time we find the opposite. Why does this happen?
Hi,
Open interest reflects the number of contracts that are held by traders and investors in active positions, ready to be traded. Volume reflects a running total throughout the trading day, and open interest is updated just once per day.
Thank you for reading our blog!
Keep Reading!!
love you Vivek sir you are god to me really sir love from Vipul