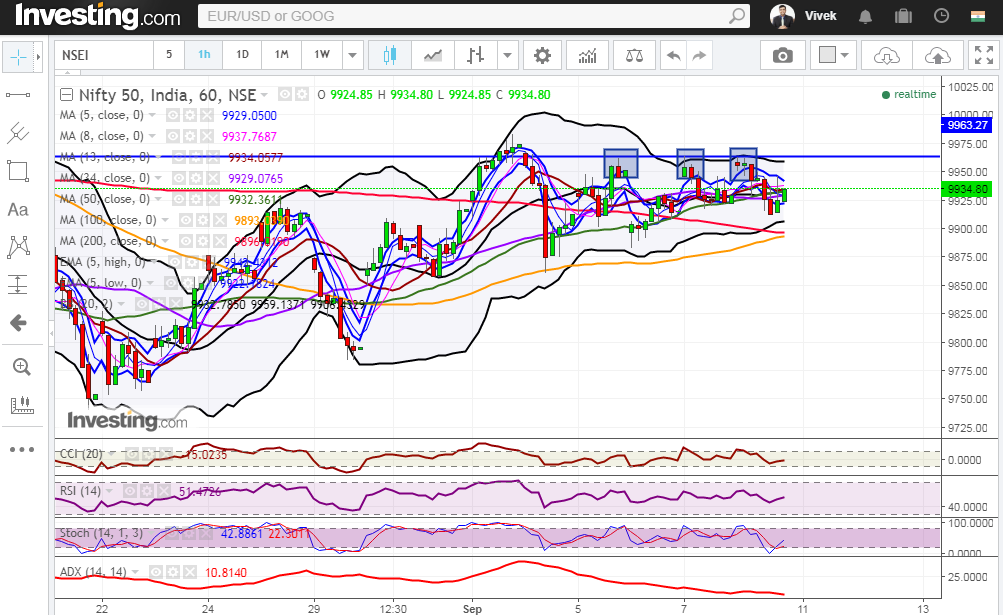
Nifty (Close 9934.8): Nifty ended on a flat note in this week and this consolidation may continue until it remains in 9850-9950 range. The bulls will be back in the game, once Nifty closes above 9950.
Hourly Technical:
In the Hourly chart, Nifty is facing resistance at 9963 and it was the third time it couldn’t breach this level in today’s session. The probable support in the hourly chart comes at Lower Bollinger line (presently at approx. 9906.4) and 200 Hour moving average (presently at approx.9896).
On the upside, Nifty may face resistance at Upper Bollinger line (presently at approx. 9959.1).
Hourly CCI and RSI are in the normal zone. Hourly Stochastic has just closed above the oversold zone. However, ADX is still falling indicating fall in momentum. Overall, Nifty remains neutral in the Hourly timeframe.
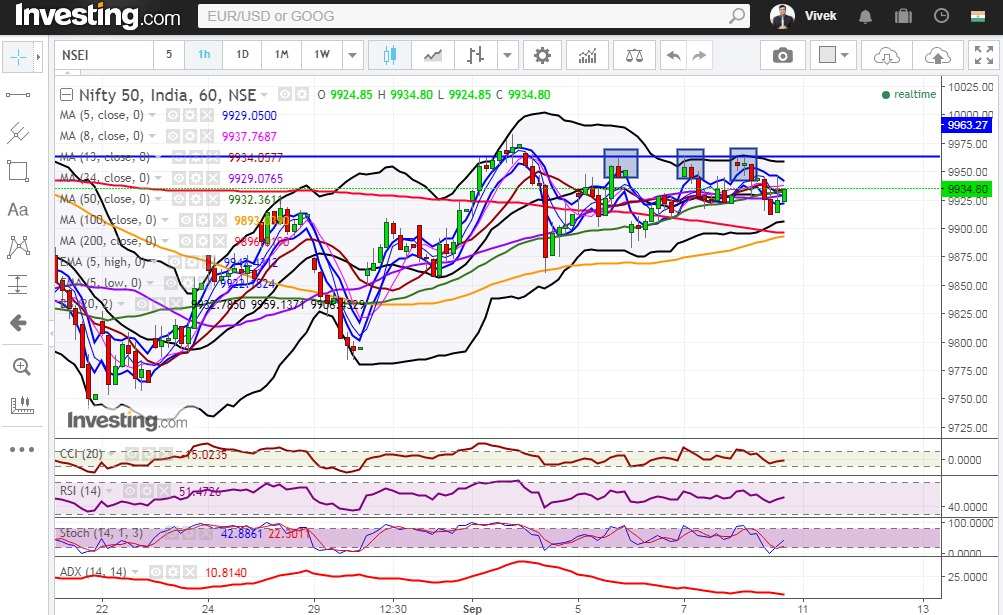
Figure: Hourly Chart
Daily Technical:
In the Daily chart, Nifty is facing constant resistance at the 5 Day High EMA (presently at approx. 9956.3) which may act as a resistance in the short term. The probable support in the hourly chart comes at 13 DMA (presently at approx.9892.8) and 20 DMA (presently at approx. 9866.3).
On the upside, Nifty may face resistance at 5 Day High EMA (presently at approx. 9956.3) and Upper Bollinger line (presently at approx. 10007.8).
Daily Stochastic and CCI are close to the upper bound of the overbought zone. RSI are still in the normal zone. The falling ADX indicates fall in momentum. Overall, Nifty remains neutral to Bullish in the Daily timeframe.
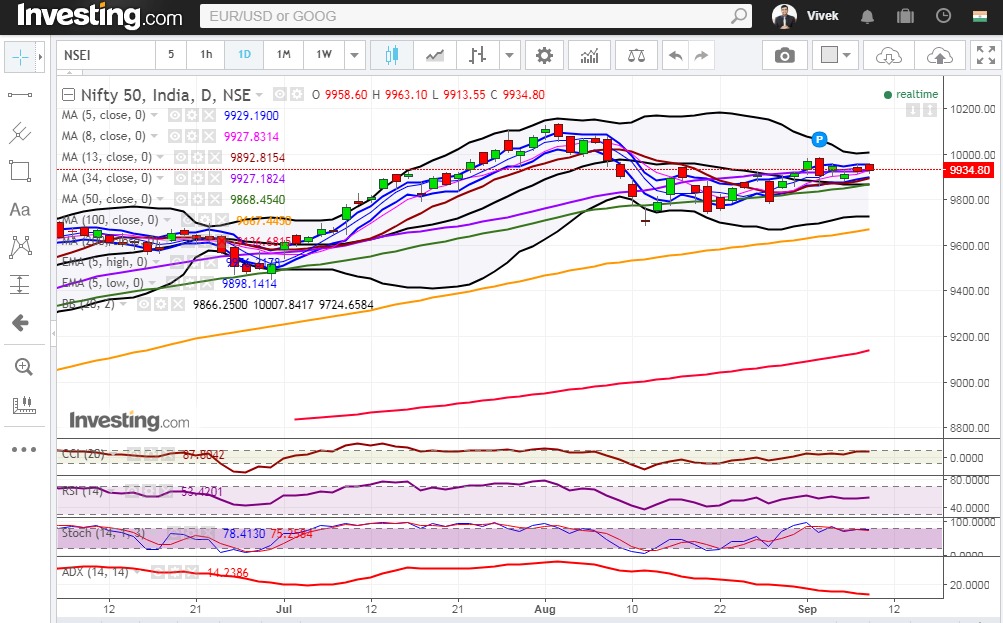
Figure: Daily Chart
Weekly Technical
In the weekly chart, the overall bearish view due to presence of long red candle last week has almost negated. The bulls will be in control once Nifty closes above 5 Week High EMA (presently at approx. 9967.2).
Weekly CCI, RSI, slow stochastic are close to the upper bound of the normal zone. Overall, Nifty remains neutral to bullish in the weekly timeframe.
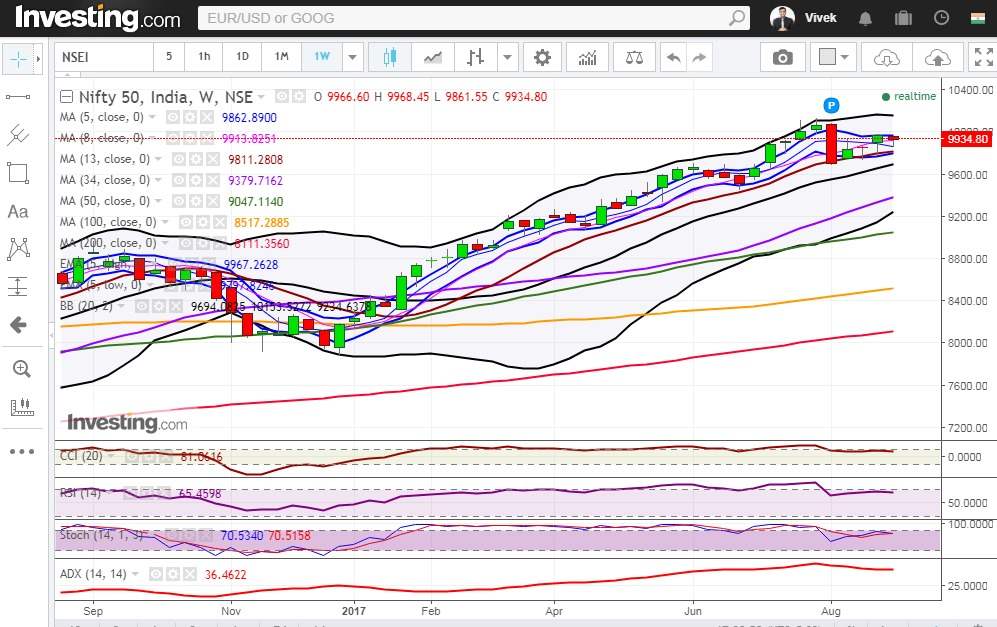
Figure: Weekly Chart
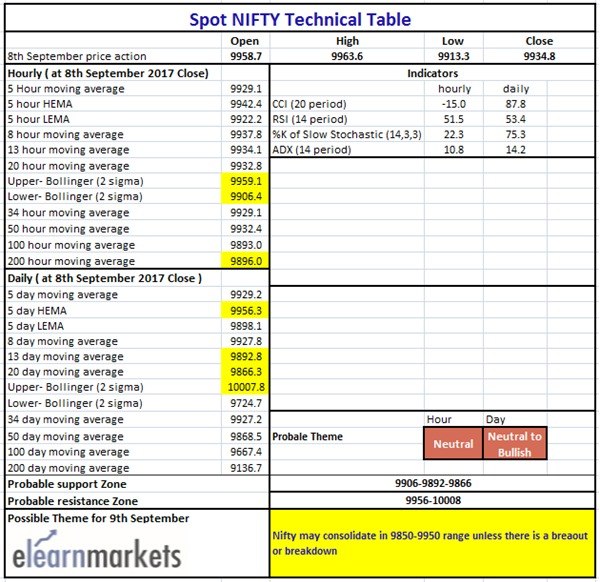
Figure: Tech Table
