Elearnmarkets - Financial Market Learning
  • Courses
  • Webinars
  • Stories
  • Language
    • English
    • Hindi
    • Bengali
No Result
View All Result
Get Free Course
  • Basic Finance
  • Derivatives
    • Futures
    • Options
  • Financial Planning
  • Fundamental Analysis
  • Technical Analysis
  • Mutual Funds
  • Marketshala
  • Miscellaneous
Elearnmarkets - Learn Stock Market, trading, investing for Free
  • Courses
  • Webinars
  • Stories
  • Language
    • English
    • Hindi
    • Bengali
No Result
View All Result
Get Free Course
Elearnmarkets - Learn Stock Market, trading, investing for Free
No Result
View All Result
Home Technical Analysis Market Analysis
Nifty Hourly Chart

Nifty likely to consolidate around 10000 before moving higher

Elearnmarkets by Elearnmarkets
August 1, 2024
in Market Analysis, Market Wrap
Reading Time: 3 mins read
0
44
VIEWS
Share on FacebookShare on XShare on WhatsApp

Nifty close 10121.8: Nifty witnessed strong selling pressure near the November expiry. The Gujarat election is an important event to watch out for in the month of December.

Hourly Technical:
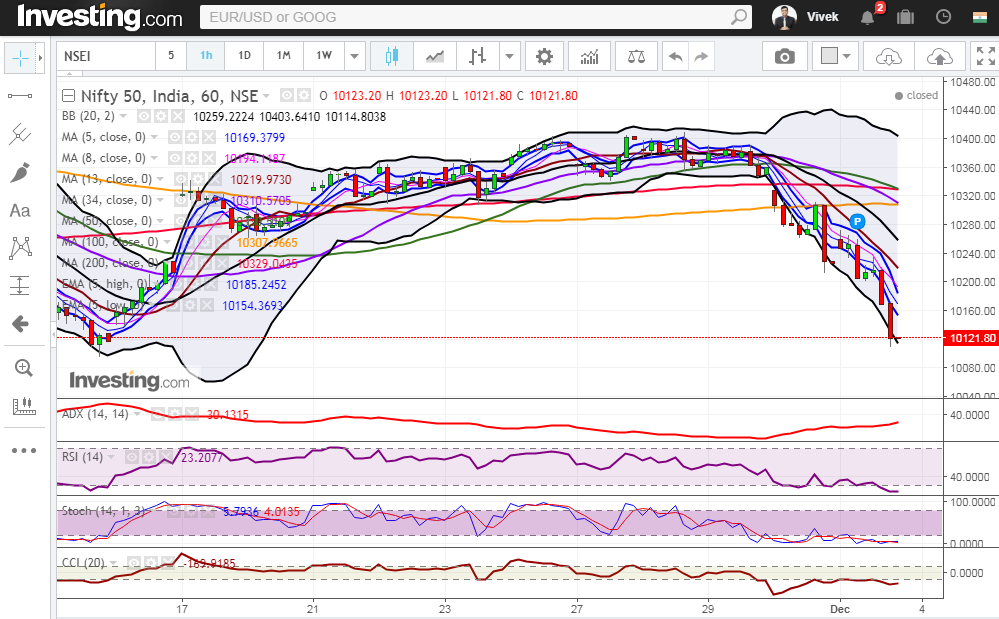
In the hourly chart, Nifty opened marginally higher but the correction continued throughout on Friday’s session. The selloff got more aggressive in the second half on Friday’s session. The probable support in the hourly chart comes at Lower Bollinger Line (presently at approx.10114.8).

On the upside, Nifty may face resistance at 5 Hour Low EMA (presently at approx.10154.4), 5 Hour moving average (presently at approx. 10169.4) and 8 Hour moving average (presently at approx. 10194.1).

Hourly CCI, Stochastic and RSI are in the oversold zone. Moreover, the ADX is upward sloping indicating intense selling pressure in the hourly chart. Overall, Nifty remained bearish in the Hourly chart.

Nifty likely to consolidate around 10000 before moving higher 1

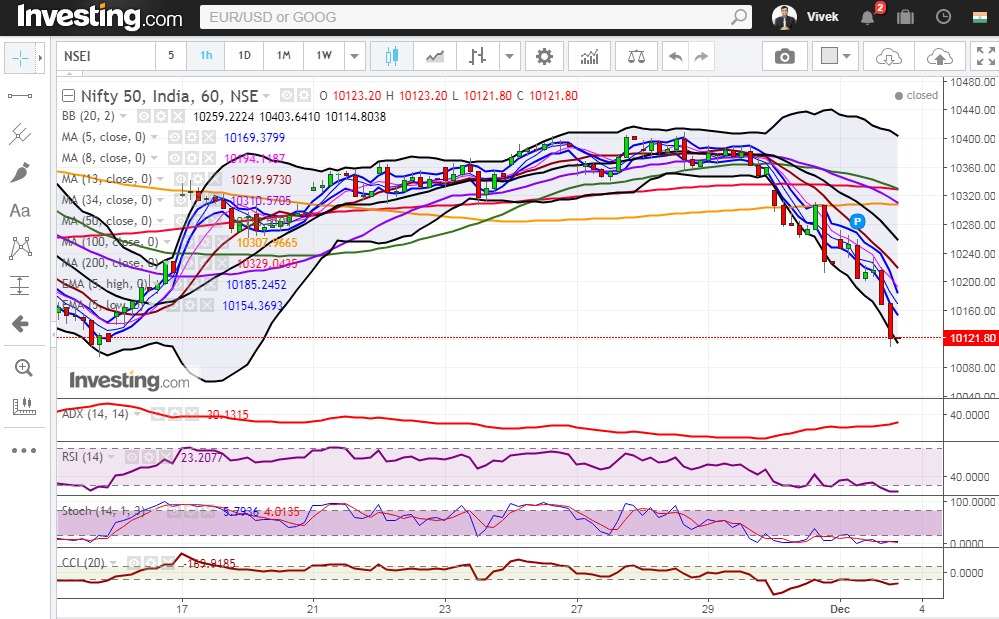
Figure: Hourly Chart
Daily Technical:
In the daily chart, Nifty broke out of the 5 Day Low EMA (presently at approx. 10233.2) suggesting weakness in the daily chart. However, Nifty may take support from 100 DMA (presently at approx. 10063.8) which is an important level for market in the coming days.

On the upside, Nifty may face resistance at 50 DMA (presently at approx. 10183.3).

Stochastic and RSI are in the normal zone but very close to the lower bound and CCI is in the oversold zone. Moreover, ADX has also turned up suggesting gain of downside momentum. Overall Nifty remains bearish to neutral in the daily chart.
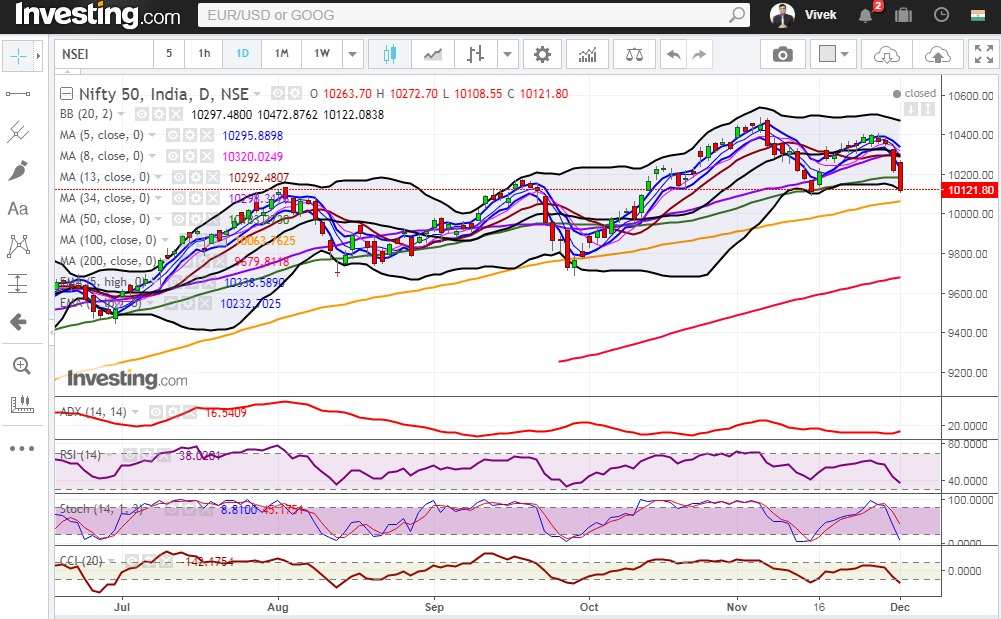
NIfty 50 daily technical Stochastic and RSI are in the normal zone but very close to the lower bound and CCI is in the oversold zone.

Figure: Daily Chart
Weekly Technical:
The benchmark indices Nifty is standing at a very crucial support in the weekly chart and there is a possibility of bounce back in the coming week.

Weekly Stochastic, RSI and CCI have come out of the overbought zone and entered the normal zone. Moreover, ADX is downward sloping indicating decrease in momentum. Overall Nifty remains neutral in the weekly chart.

Weekly Nifty 50 chart showing nifty is standing at a very crucial support in the weekly chart and there is a possibility of bounce back in the coming week


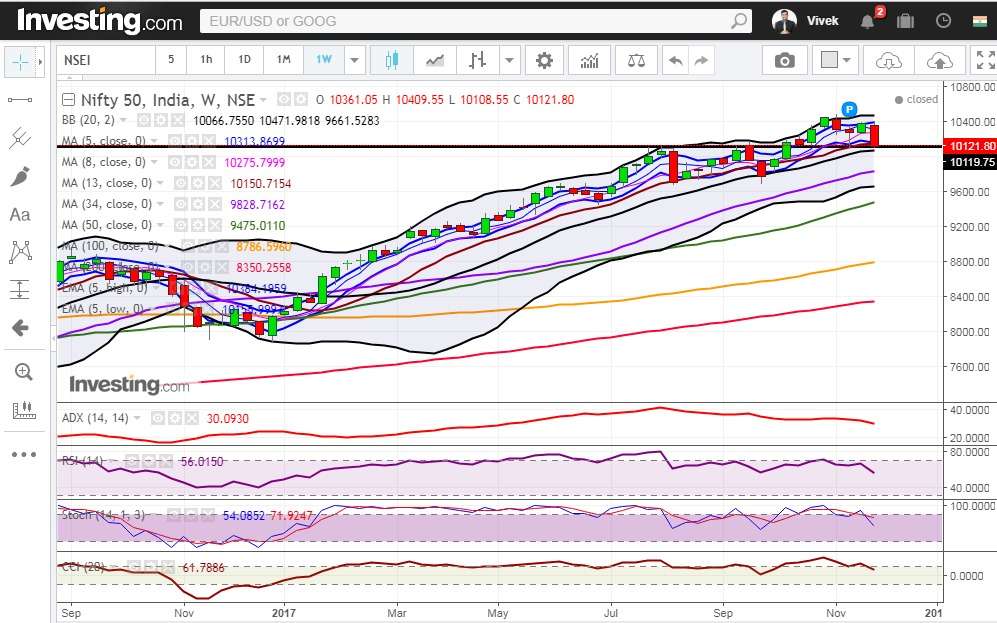
Figure: Weekly Chart
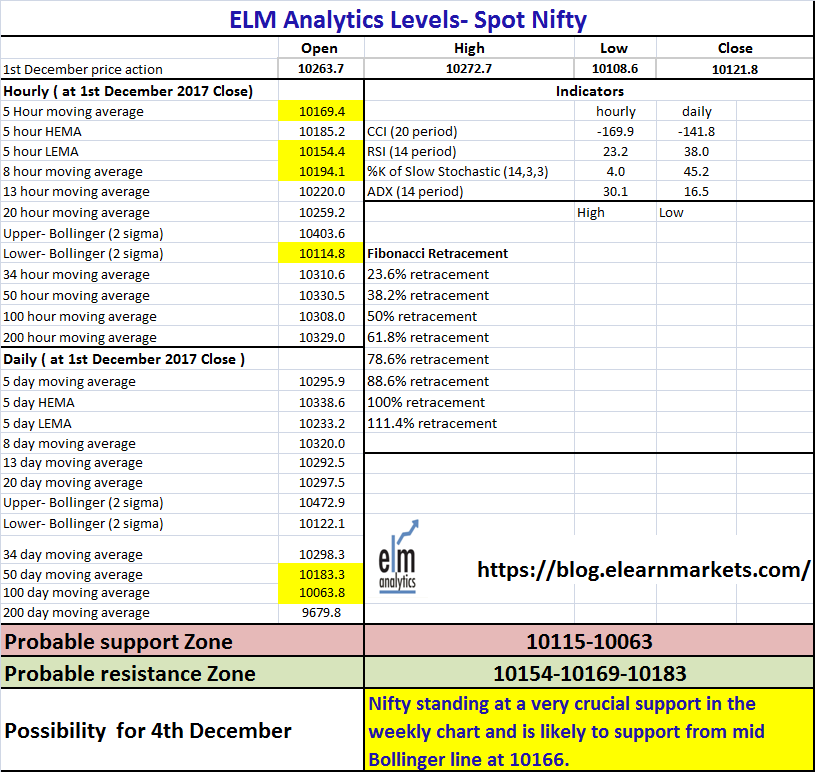

Nifty Tech Table
Figure: Tech Table

Tags: english
ShareTweetSend
Get Kotak Offer Get Kotak Offer Get Kotak Offer
Previous Post

Bank Nifty Likely to Fill Gap On the Downside

Next Post

Nifty reverses gear as D-day of Gujarat election nears

Elearnmarkets

Elearnmarkets

Elearnmarkets (ELM) is a complete financial market portal where the market experts have taken the onus to spread financial education. ELM constantly experiments with new education methodologies and technologies to make financial education effective, affordable and accessible to all. You can connect with us on Twitter @elearnmarkets.

Related Posts

Nifty hits 10500 mark and ends at record closing high 2
Market Analysis

Nifty hits 10500 mark and ends at record closing high

August 1, 2024
60
Nifty cheered the exit poll outcomes for Gujarat Assembly Elections 3
Market Analysis

Nifty cheered the exit poll outcomes for Gujarat Assembly Elections

August 1, 2024
74
Nifty reverses gear as D-day of Gujarat election nears 4
Market Analysis

Nifty reverses gear as D-day of Gujarat election nears

August 1, 2024
80
Bank Nifty Hourly
Market Analysis

Bank Nifty Likely to Fill Gap On the Downside

August 1, 2024
57

Leave a Reply Cancel reply

Your email address will not be published. Required fields are marked *

Disclaimer

Elearnmarkets (Kredent InfoEdge Pvt. Ltd.) is a SEBI-registered Research Analyst (RA) entity (SEBI Registration No.: INH300007493). The information provided in this article is for educational and informational purposes only and should not be considered as an offer to buy or sell any securities or investment products.

The stocks, securities, and investment instruments mentioned herein are not recommendations under SEBI (Research Analysts) Regulations, 2014. Readers are advised to conduct their own due diligence and seek independent financial advice before making any investment decisions.

Investments in securities markets are subject to market risks. Please read all related documents carefully before investing. Investing in Equity Shares,
Derivatives, Mutual Funds, or other instruments carry inherent risks, including potential loss of capital. Elearnmarkets (Kredent InfoEdge Pvt. Ltd.) does not provide any guarantee or assurance of returns on any investments. Past performance is not indicative of future performance.

Elearnmarkets Logo

Follow Us

Facebook-f X-twitter Instagram Linkedin-in Youtube Telegram

Register on Elearnmarkets

Continue your financial learning by creating your own account on Elearnmarkets.com

Register Free Account

Download App

Playstore logo
Download on app store

Categories

  • Basic Finance
  • Derivatives
  • Financial Planning
  • Fundamental Analysis
  • Technical Analysis
  • Mutual Funds
  • Miscellaneous

Popular On Elearnmarkets

  • Market Superheroes:
  • Vivek Bajaj
  • Chetan Panchamia
  • Ashish Kyal
  • Premal Parekh
  • Abhijit Paul
  • Jegan
  • Sivakumar Jayachadran
  • Jyoti Budhia
  • Vivek Gadodia
  • Vishal Mehta
  • Piyush Chaudhry
  • Santosh Pasi
  • Gomathi Shankar
  • Market Superheroes:
  • Vivek Bajaj
  • Chetan Panchamia
  • Ashish Kyal
  • Premal Parekh
  • Abhijit Paul
  • Jegan
  • Sivakumar Jayachadran
  • Jyoti Budhia
  • Vivek Gadodia
  • Vishal Mehta
  • Piyush Chaudhry
  • Santosh Pasi
  • Gomathi Shankar
  • Courses:​
  • Options Trading
  • Dow Theory
  • Momentum Trading
  • Stock Investing
  • Harmonic Chart Patterns
  • Algo Trading
  • Elliot Wave Theory
  • Advanced Excel
  • Cryptocurrency
  • NSE Certification Course
  • Courses:​
  • Options Trading
  • Dow Theory
  • Momentum Trading
  • Stock Investing
  • Harmonic Chart Patterns
  • Algo Trading
  • Elliot Wave Theory
  • Advanced Excel
  • Cryptocurrency
  • NSE Certification Course
  • Webinars:
  • Bank Nifty Scalping
  • Intraday Trading Strategies
  • Options Trading Strategies
  • Options selling
  • Price Action
  • Relative Strength
  • Tax Planning
  • Options Buying
  • Growth Stocks
  • Portfolio Management
  • Risk Management
  • Renko Charts
  • Crude Oil
  • Traders Psychology
  • Moving Average
  • Multibagger Stocks
  • Free Learning Modules:
  • Intraday Trading
  • Options Scalping
  • Swing Trading
  • Financial Modelling
  • RSI Indicator
  • Bollinger Bands
  • Pricing of Futures
  • Personal Finance
  • Initial Public Offerings (IPO)
  • Value Investing
  • Technical Indicators
  • Candlesticks
  • Chart Patterns
  • Option Greeks
  • ELSS Funds
  • Banking and Insurance
  • Real Estate
  • Gold
  • Book Summaries:
  • Rich Dad Poor Dad
  • Psychology of Money
  • The Intelligent Investor
  • The Richest Man in Babylon
  • Think and Trade Like a Champion
  • Value Investing and Behavioural Finance
  • Trading in the Zone
  • Learn to Earn
  • Book Summaries:
  • Rich Dad Poor Dad
  • Psychology of Money
  • The Intelligent Investor
  • The Richest Man in Babylon
  • Think and Trade Like a Champion
  • Value Investing and Behavioural Finance
  • Trading in the Zone
  • Learn to Earn
  • Tools:
  • CAGR Calculator
  • SIP Calculator
  • eLearnOptions
  • Future Value Calculator
  • Present Value Calculator
  • Atal Pension Yojana
  • Cost of Delay Calculator
  • Become a Crorepati
  • Tools:
  • CAGR Calculator
  • SIP Calculator
  • eLearnOptions
  • Future Value Calculator
  • Present Value Calculator
  • Atal Pension Yojana
  • Cost of Delay Calculator
  • Become a Crorepati

© 2025 Elearnmarkets. All Rights Reserved

  • Visit Elearnmarkets
  • Courses
  • Webinars
  • Financial Guides
  • Get Free Counselling
  • Visit Elearnmarkets
  • Courses
  • Webinars
  • Financial Guides
  • Get Free Counselling

Download Our App

No Result
View All Result
  • Article Categories
    • Basic Finance
    • Derivatives
    • Financial Planning
    • Fundamental Analysis
    • Technical Analysis
    • ETFs & Mutual Funds
    • Marketshala
    • Miscellaneous
  • Language
    • Hindi
    • Bengali
    • English
  • Courses
  • Webinars
  • Stories
Get Free Course

© 2024 Elearnmarkets All Rights Reserved

Trading Mentorship Program