Nifty close 10303.2: Nifty extended losses for the second consecutive session in today’s trade after yesterday’s close below 5 Day Low EMA. The index found some support around the 20 DMA area in the daily chart from where it bounced back to close above 10300.
Hourly Technical:
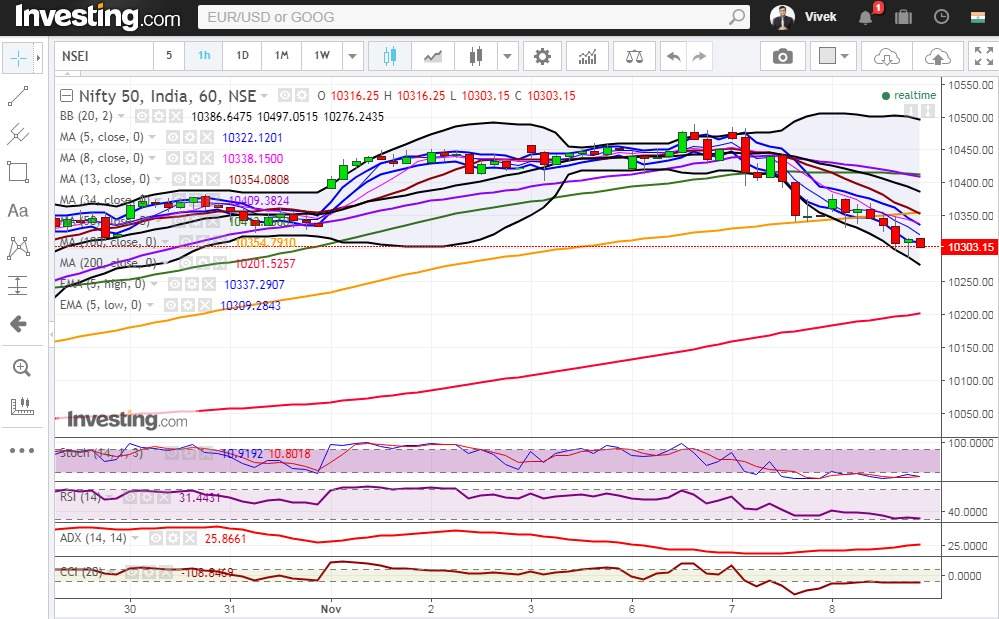
In the hourly chart, Nifty opened almost flat but the bears were in the front foot to drag the index down throughout the day.
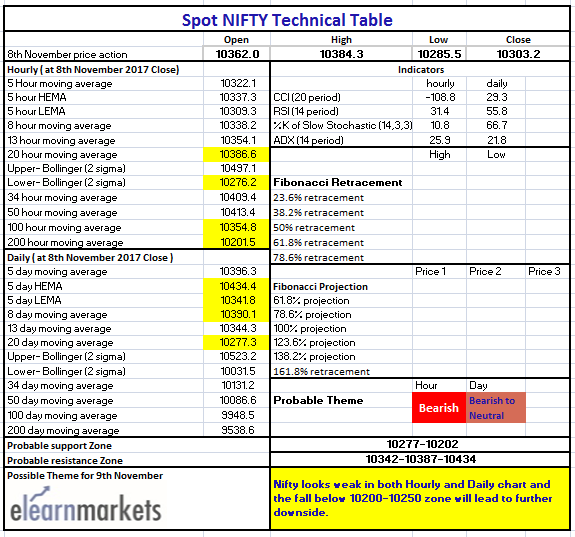
The probable support in the hourly chart comes at Lower Bollinger line (presently at approx. 10276.20) and 200 Hour moving average (presently at approx. 10201.5).
On the upside, Nifty may face resistance at 100 Hour moving average (presently at approx. 10354.8) and 20 Hour moving average (presently at approx. 10386.6).
Hourly CCI and RSI are in the oversold zone while RSI is very close to the lower bound. Moreover, the ADX is still up suggesting gain in downside momentum. Overall, Nifty remained bearish in the Hourly chart.

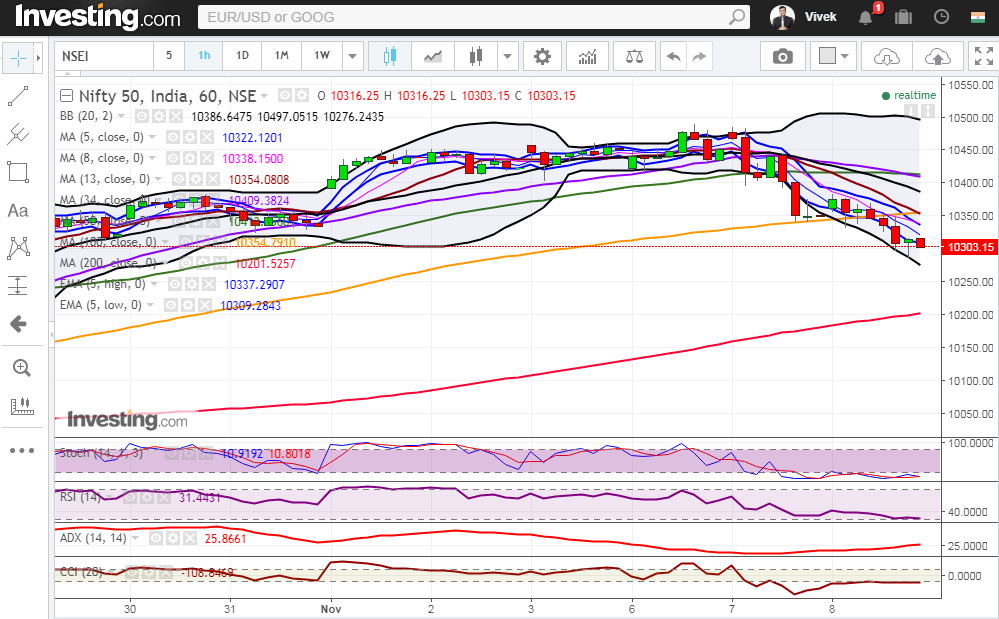
Figure: Nifty Hourly Chart
Daily Technical:
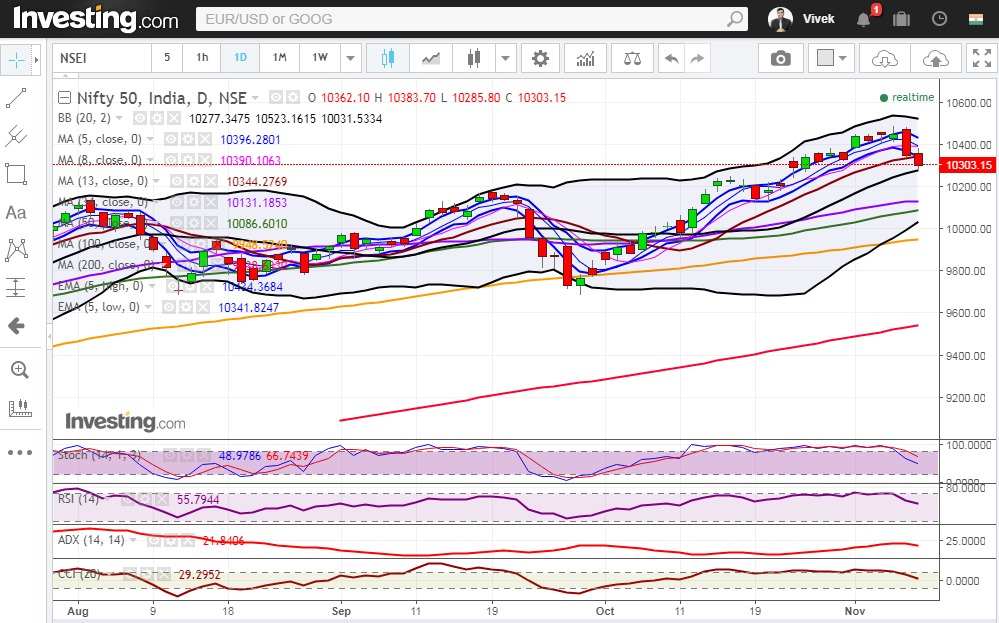
In the daily chart, the downward momentum continues as long as it remains below 5 Day Low EMA but it took support from the 20 DMA line which is an important level to watch out for.
The probable support in the daily chart comes at 20 DMA (presently at approx. 10277.3).
On the upside, Nifty may face resistance at 5 Day Low EMA (presently at approx. 10341.8), 8 DMA (presently at approx. 10390.1) and 5 Day High EMA (presently at approx.10434.4).
Stochastic, CCI and RSI are in the normal zone while ADX has also turned down suggesting loss of upside momentum. Overall Nifty remains neutral to bearish in the daily chart.

Figure: Nifty Daily Chart

Figure: Nifty Tech Table


