![Nifty Future Daily Chart with trendline, resistance and support](https://blog.elearnmarkets.com/wp-content/uploads/2023/08/NIFTY-FUTURE-CHART-DAILY-1.jpeg)
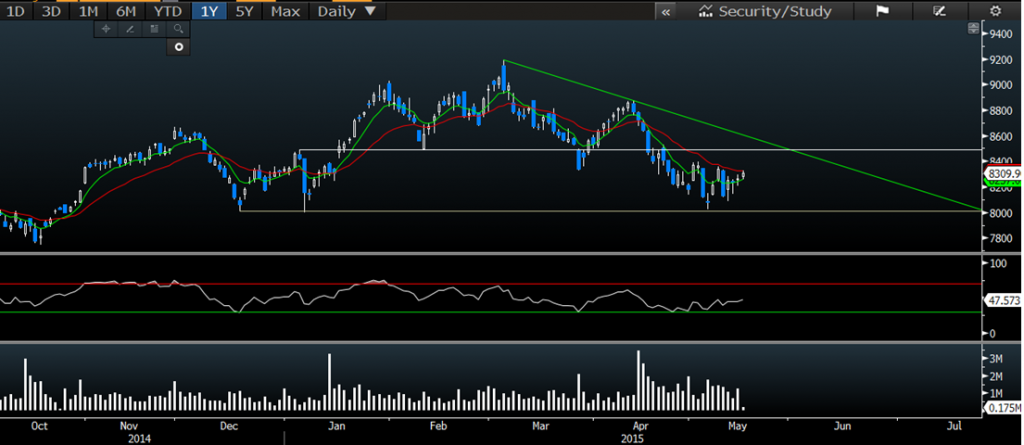
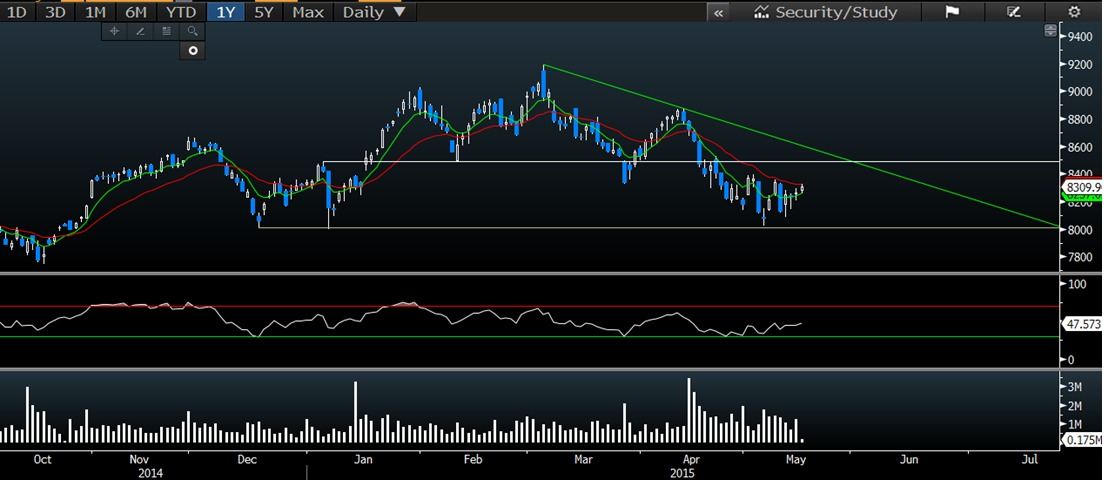
Trend showing lower highs, take support from 8000( area), and near term resistance is at 8500 (area). Can expect any strong buy above 8500.
![Nifty Future Chart Daily, Weekly, Monthly 1](https://blog.elearnmarkets.com/wp-content/uploads/2023/08/NIFTY-FUTURE-CHART-WEEKLY_1021.jpeg)
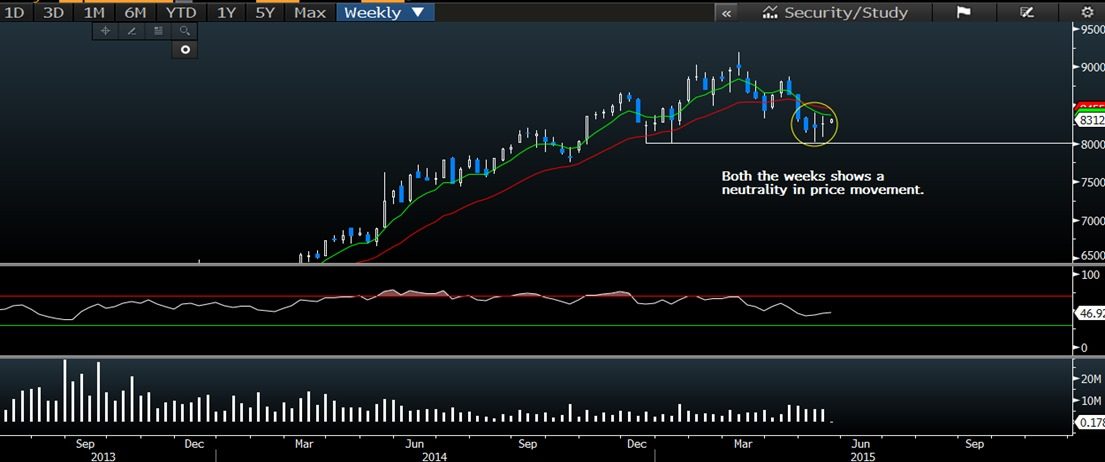
Last two week candle formed a Spinning top and a Doji pattern, which indicates that both Bulls and Bears are in control.
![Nifty Future Chart Daily, Weekly, Monthly 2](https://blog.elearnmarkets.com/wp-content/uploads/2023/08/NIFTY-FUTURE-CHART-MONTHLY_761.jpeg)
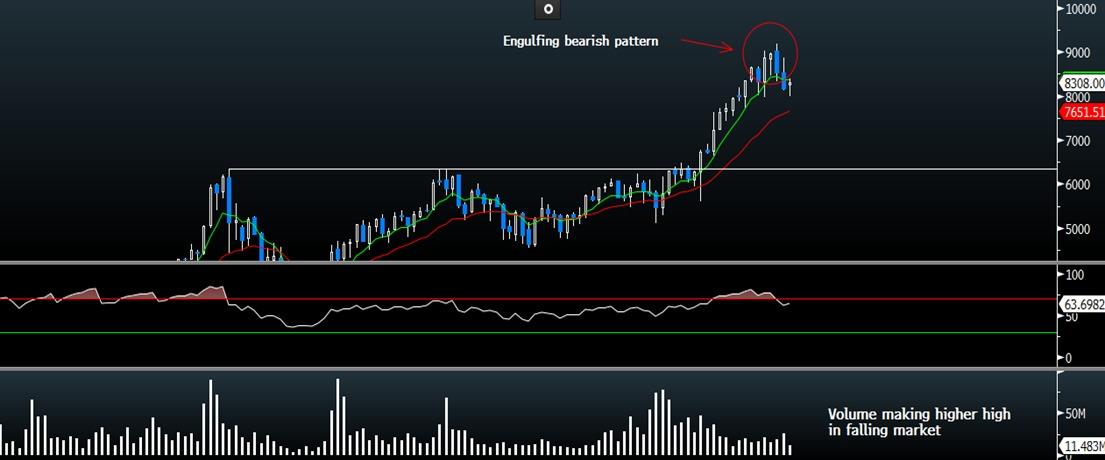
Monthly chart showing bearish move, with good volume support.