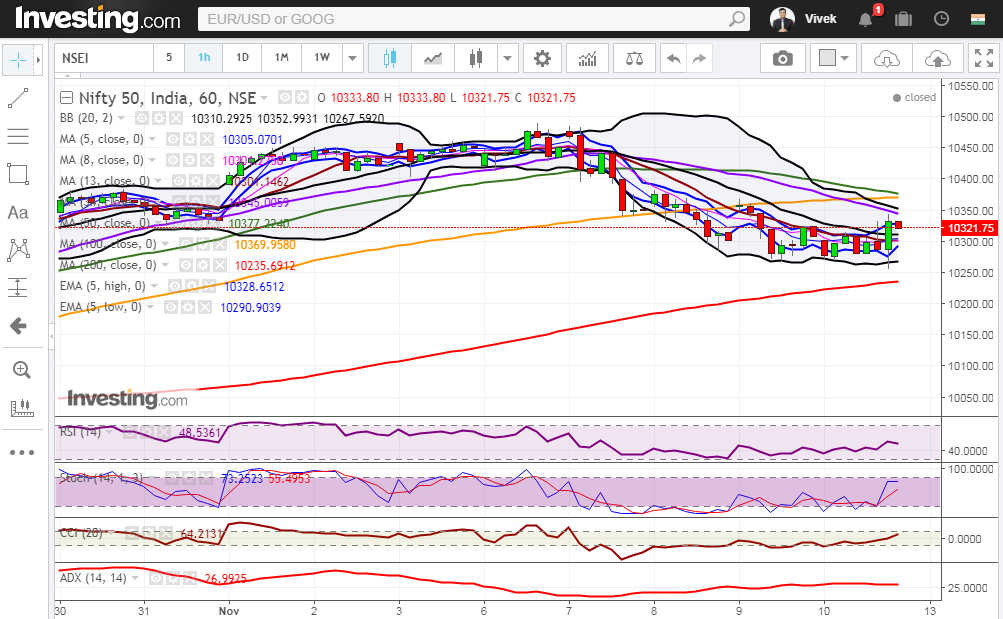
Nifty close 10321.8: The index posted 1% loss for the week but ended Friday’s session mildly higher post GST council meet. Nifty likely to consolidate in 10200-10400 range, break on either side will decide further move.
Hourly Technical:
In the hourly chart, Nifty opened flat, finds support from the lower Bollinger line and ended marginally higher. The probable support in the hourly chart comes at 13 Hour Moving Average (presently at approx.10301.1) and 200 Hour Moving average (presently at approx.10235.7).
On the upside, Nifty may face resistance at Upper Bollinger line (presently at approx.10353) and 100 Hour moving average (presently at approx.10370).
Hourly CCI, Stochastic and RSI are in the normal zone. Moreover, the ADX has turned flat suggesting fall in momentum. Overall, Nifty remained neutral to bearish in the Hourly chart.
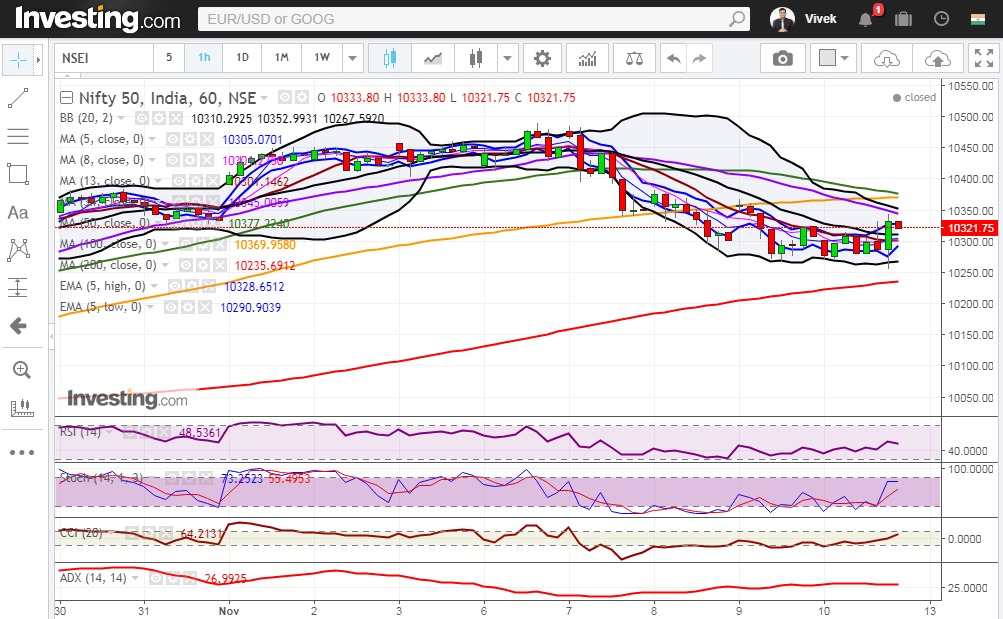
Figure: Hourly Chart
Daily Technical:
In the daily chart, Nifty finds support from the 20 DMA for the consecutive three days and closed marginally higher inside the 5 Day High-Low Band.
The probable support in the daily chart comes at 20 DMA (presently at approx.10304.8) and 5 Day Low EMA (presently at approx.10296.5).
On the upside, Nifty may face resistance at 13 DMA (presently at approx.10362.6) and 5 Day High EMA (presently at approx.10389.6).
Stochastic, CCI and RSI are in the normal zone while ADX has also turned down suggesting loss of upside momentum. Overall Nifty remains neutral to bearish in the daily chart.
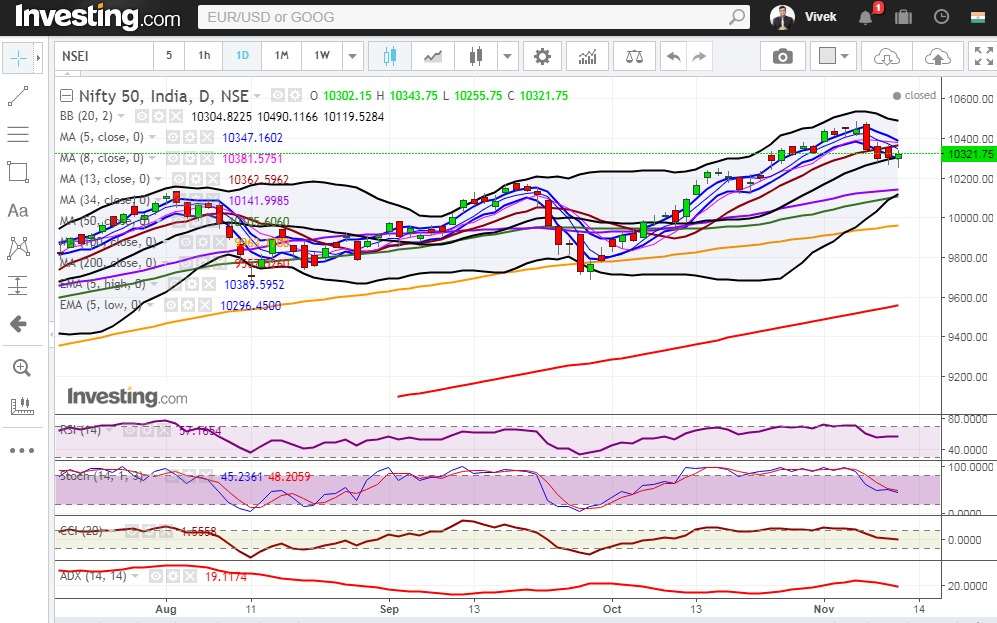
Figure: Daily Chart
Weekly Technical
In the weekly chart, Nifty bounces off the 5 Week Moving average and enters the 5 week High-Low band suggesting some consolidation.
Weekly Stochastic and CCI are in the overbought zone but RSI has entered the normal zone from overbought zone. Moreover, ADX has again turned flat indicating decrease in momentum. Overall Nifty remains very neutral to bullish in the weekly chart.
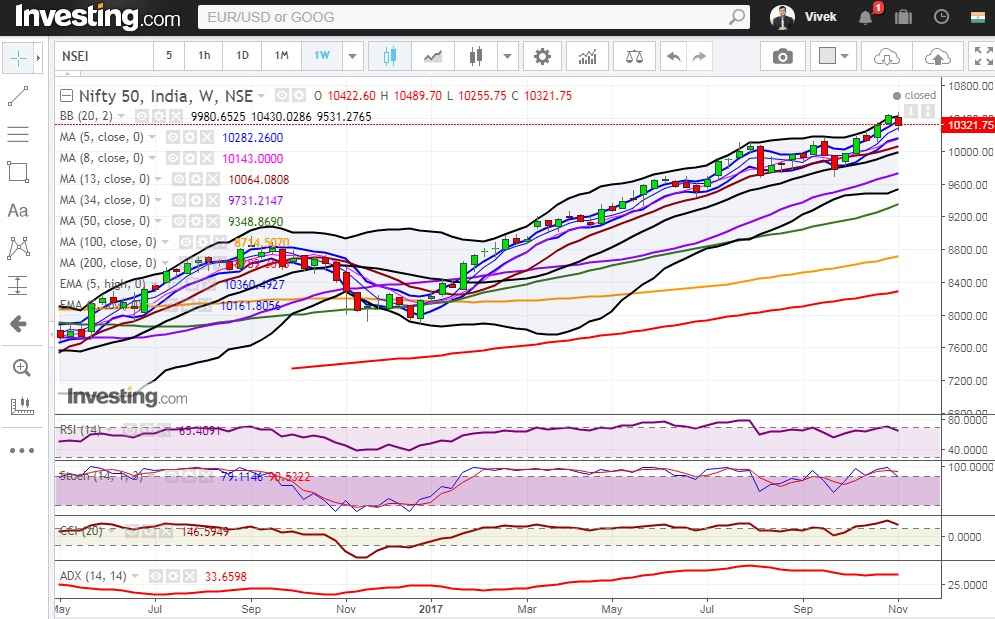
Figure: Weekly chart
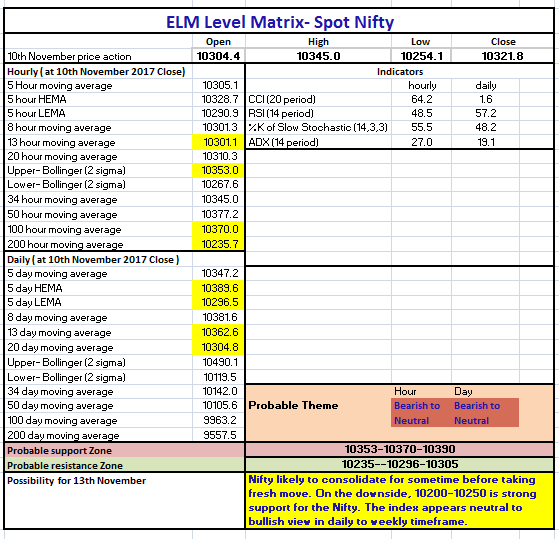
Figure: Tech Table
You can also view the Original Report here.
