Keytakeaways:
- Morning Star is a bullish reversal pattern formed by three candles after a downtrend
- It signals weakening selling pressure and a possible trend shift when confirmed by volume or RSI
- Works well near support zones or lower Bollinger Bands
- StockEdge scans help identify this pattern across stocks quickly
- It may fail in sideways or news-driven markets without confirmation
Morning Star candlestick is a triple candlestick pattern that indicated bullish reversal.
It is formed at the bottom of a downtrend and it gives us a warning sign that the ongoing downtrend is going to reverse.
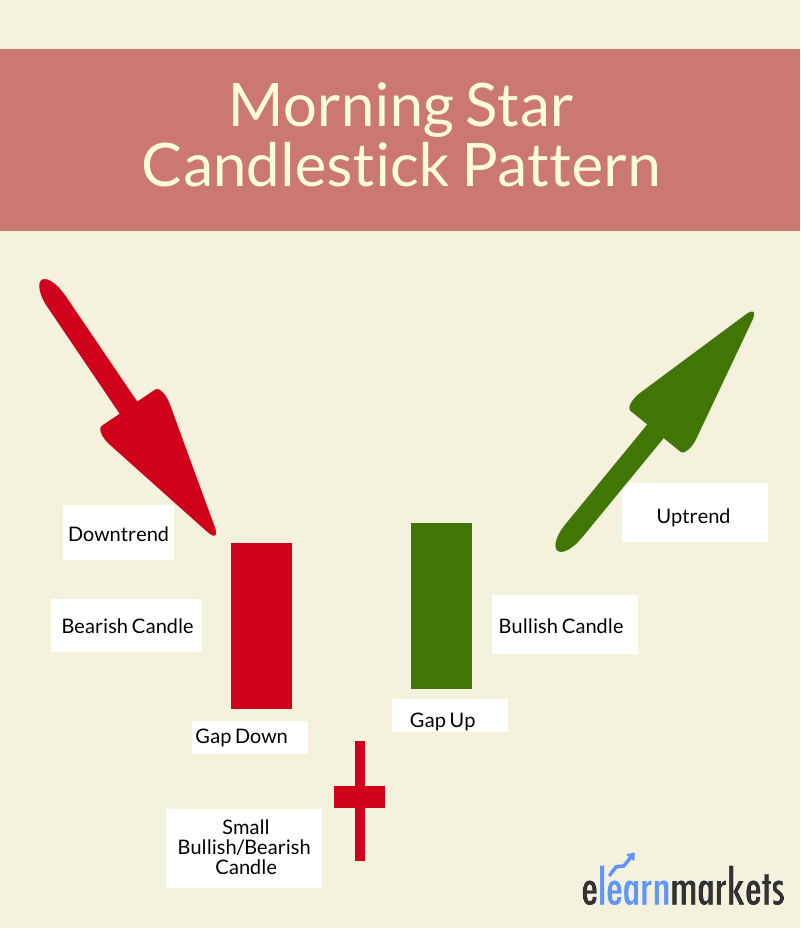
It consists of three candles; the first one being a bearish candlestick, the second one can be bullish or bearish with a small body, and the third one is a bullish candle.
Let us discuss this triple candlestick pattern’s meaning, formation, and trading techniques.
- What is Morning Star Candlestick Pattern?
- Formation of Morning Star:
- What does Morning Star Candlestick Pattern tell us?
- Trading with the Morning Star
- Difference between Morning Star and Evening Star
- How to use Morning Star Candlestick Scans in StockEdge?
- Limitations
- Bottomline
- Frequently Asked Questions (FAQs)
What is Morning Star Candlestick Pattern?
A morning star is a candlestick pattern that consists of three candlesticks.
A morning star is formed after a downward trend and signals the beginning of an upward movement of prices.
It is a signal of a reversal in the prior price trend.
Traders should analyze the formation of a morning star and then seek confirmation that a reversal is confirmed using technical indicators.
Formation of Morning Star:
The formation of this candlestick pattern is as below:
What does Morning Star Candlestick Pattern tell us?
When the market is in a bearish trend, most traders expect that it is going to continue down further.
The current market sentiment is bearish, and traders are either shorting or out of the market waiting for a bullish trend to start.
When the first candle of the morning star forms, this sentiment holds one. When the second candle is formed, then the market seems to be another bearish day as the candle gaps down.
As the market has gone down quite a lot, some traders may begin to think that it is going to reverse. They start assuming that reverse must be coming, as it has continued down for some time.
Due to this the buying pressure increases and it makes it harder for the bears to continue pushing the prices down. The market closes around where it opened, and thus creates a Doji candlestick pattern.
The third-day candle confirms that the bulls have taken control over the prices. The market gaps up, and more people are expecting the trend to reverse. Due to this sentiment, the third candle is a bullish candlestick.
Trading with the Morning Star
As we have discussed above that we should trade morning star with other technical indicators.
Let us discuss some trading strategies:
Bollinger Bands
As we have discussed, the morning star is formed after a bearish trend and signals bullish reversal.
When using the Bollinger bands, one should enter the trade when the morning is formed below the lower Bollinger band.
We usually find the middle candle to be below the lower Bollinger band.
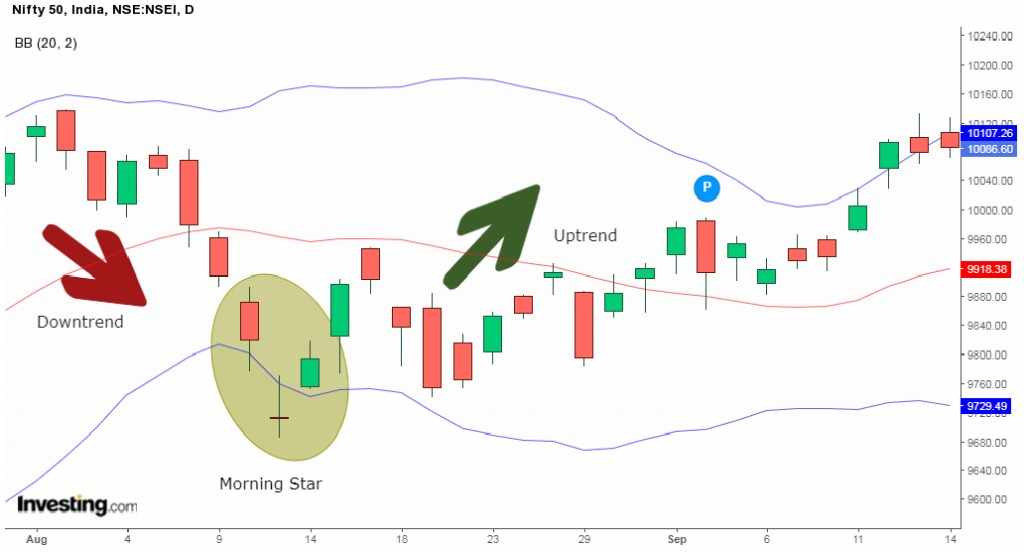
From the daily chart of Nifty 50, we can see that after a downtrend, the morning star is formed, with the middle candle below the lower Bollinger Band.
One can enter the trade after the complete formation of the morning star.
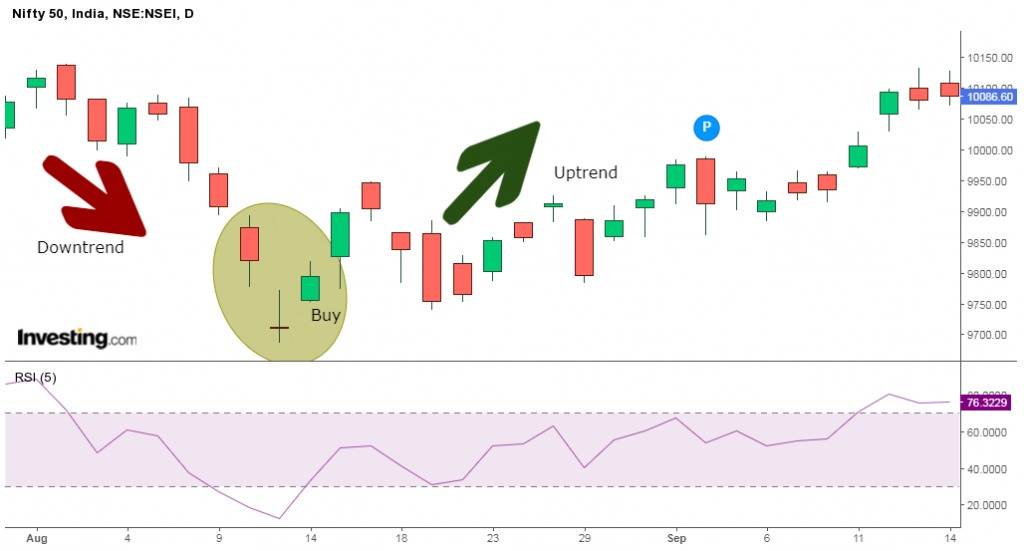
Relative Strength Index:
For this strategy, we will be using 5 periods RSI.
We will enter into the buy position when the RSI moves above 30, from below with the formation of morning star on the chart.
From the daily chart of Nifty 50 above, we can how the RSI crosses 30 when the morning star is formed.
Difference between Morning Star and Evening Star
The evening star is the opposite of the morning star. The evening star is a long bullish candle that is followed by a short bearish or bullish one and then a long bearish one.
It indicates reversal to bearish trend whereas the morning star indicates reversal to the bullish trend.
Read More- All 35 Candlestick Chart Patterns in the Stock Market

How to use Morning Star Candlestick Scans in StockEdge?
You can also use the Shooting Star Candlestick scans in StockEdge web version:
Steps to use Morning Star Candlestick scans in StockEdge:
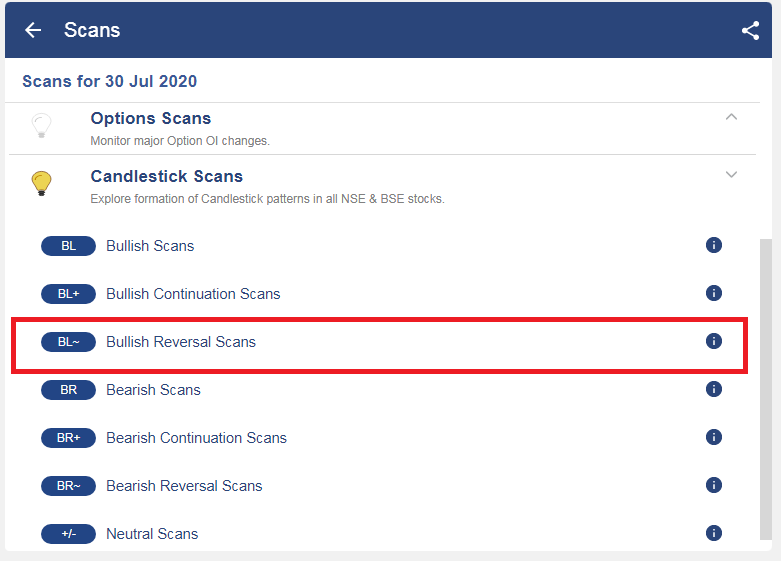
- Under the “Candlestick Scans” we can see Bullish Reversal scans as shown below:
- When we click on the “Bullish Reversal scans” we can see “Morning Star Candlestick” scan, click on that:
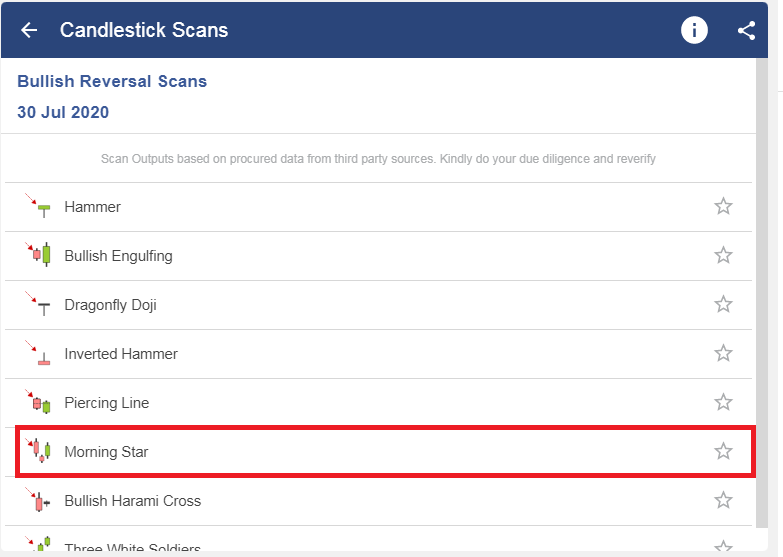
After selecting on it, you will get a list of stocks in which “Morning Star Candlestick” pattern is formed.
Limitations
One should not trade purely on visual patterns. When a morning star is backed up by volume and other technical indicators like a support level, then it confirms the signal.
Bottomline
A morning star pattern is formed at the bottom of a downtrend, and it gives us a warning sign that the ongoing downtrend is going to reverse. Traders should analyze the formation of a morning star and then seek confirmation that a reversal is confirmed using technical indicators. Trading strategies using the Bollinger Band and Relative Strength Index. When a morning star is backed up by volume and other technical indicators like a support level, then it confirms the signal.
Frequently Asked Questions (FAQs)
Is morning star bullish or bearish?
A possible bottom is indicated by the bullish three-candlestick pattern known as the Morning Star. It signals the possibility of a trend reversal due to weakness in a downward trend. Three candlesticks make up the morning star, with the middle candlestick forming the shape of a star.
What is the morning star candlestick strategy?
A set of three candlesticks on a market’s chart that portend an impending bullish reversal is known as the morning star pattern. Technical traders interpret the appearance of a morning star following a decline as evidence that buyers are beginning to outnumber sellers.


Doji candlestick pattern link broken
Hi,
We have fixed the link, also you can read the blog on Doji Candlestick Pattern from here.
Thank you for your feedback!
Keep Reading!