Elearnmarkets - Financial Market Learning
  • Categories
    • Basic Finance
    • Derivatives
    • Financial Planning
    • Fundamental Analysis
    • Technical Analysis
    • Marketshala
    • Miscellaneous
  • Language
    • English
    • Hindi
    • Bengali
No Result
View All Result
  • Courses
  • Webinars
  • Learn On Elearnmarkets
Elearnmarkets - Learn Stock Market, trading, investing for Free
No Result
View All Result
Home Technical Analysis Charts, Patterns & Indicators
Marubozu

Marubozu Pattern – The Candle with the Shaven Head

Elearnmarkets by Elearnmarkets
May 16, 2022
in Charts, Patterns & Indicators, Technical Analysis
Reading Time: 4 mins read
2
6.6k
VIEWS
Share on FacebookShare on TwitterShare on WhatsApp
Table of Contents
What is Marubozu Pattern?
Marubozu Pattern Formation
Bottomline

What is Marubozu Pattern ?

The term Marubozu pattern can be translated into Japanese as “Close-Cropped” or “Shaven-Head”. It is a type of candle-stick pattern which has no upper or lower shadow.

If a candle has no lower shadow, we can say that it has a shaved bottom.

If a candle has no upper shadow (also known as wick), we can say that it has a shaved top.

Also Read: Japanese Candlestick Pattern: MARUBOZU

The interpretation of the Marubozu pattern can depend on the color of candlestick formed.

If it is a long white line pattern or a long black like pattern, it basically means a very bullish day or a bearish day.

In case of a bullish day, if it is a long white (or green/blue) candle then it depicts an  UP day. 

Join TMP Join TMP Join TMP

 On the other hand, in case of a bearish pattern, if it is a long black(or red) candle, it depicts a DOWN day.

Marubozu

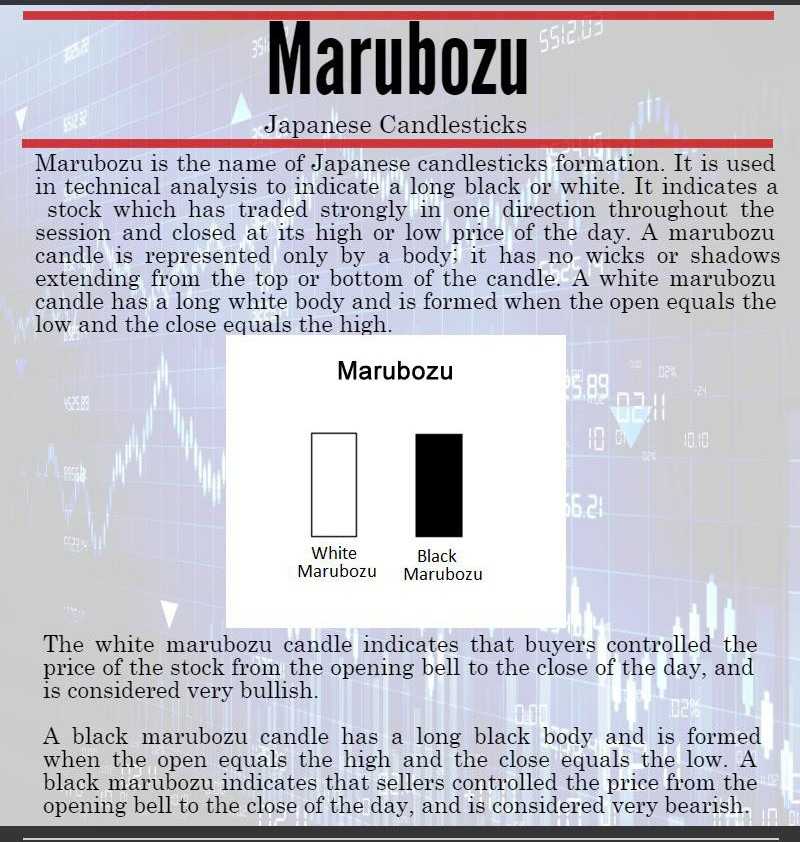
In a bullish Marubozu, the opening of the candle is very close to the low of the day.

The price keeps on going higher during the day and finally closes at or near the high of the day.

The range between the high and low is very large.

Learn from Experts : How to Trade with Candlesticks?

In a similar way, a bearish Marubozu opens near the high of the day and keeps falling to close near the low of the candle. 

The qualification of a marubozu candle can only be determined in comparison to the candles immediately preceding it.

For example, if the Marubozu appears as a long day in a very quiet and subdued market, it may be far less long compared to the candles that will precede it in a volatile market.

As the typical trading range for a day in a volatile trading day is much higher.

As a general observation, for a candlestick to qualify as a Marubozu, the body of the candle should be at least three times the size of the previous day’s candle.

If we look at the recent Marubozu candlestick patterns that formed in the Indian stock market lately, we can see the following stocks:

To know about other candlesticks, read our blog on All 35 Candlestick Chart Patterns in the Stock Market-Explained

Marubozu Candlestick Formation

Reliance

Maru Reliance
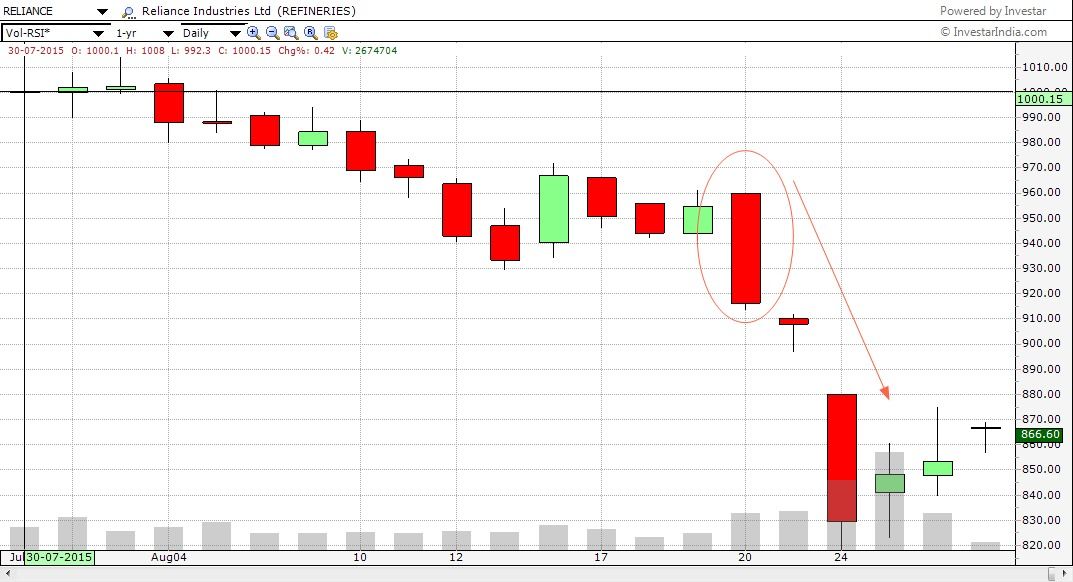
A Bearish Marubozu pattern formed in the daily chart of Reliance Industries Ltd. on 20.08.2015.

As we can see here, there is no upper shadow in the candle and very negligible lower shadow.

The body of the candle is more than three times the size of the previous day’s candle.

The bearish implications of the candle can be further confirmed by the gap down in the stock the next day.
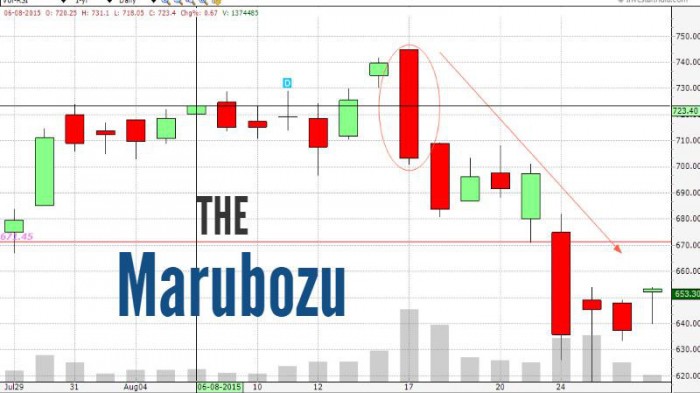
Cipla

CIPLA
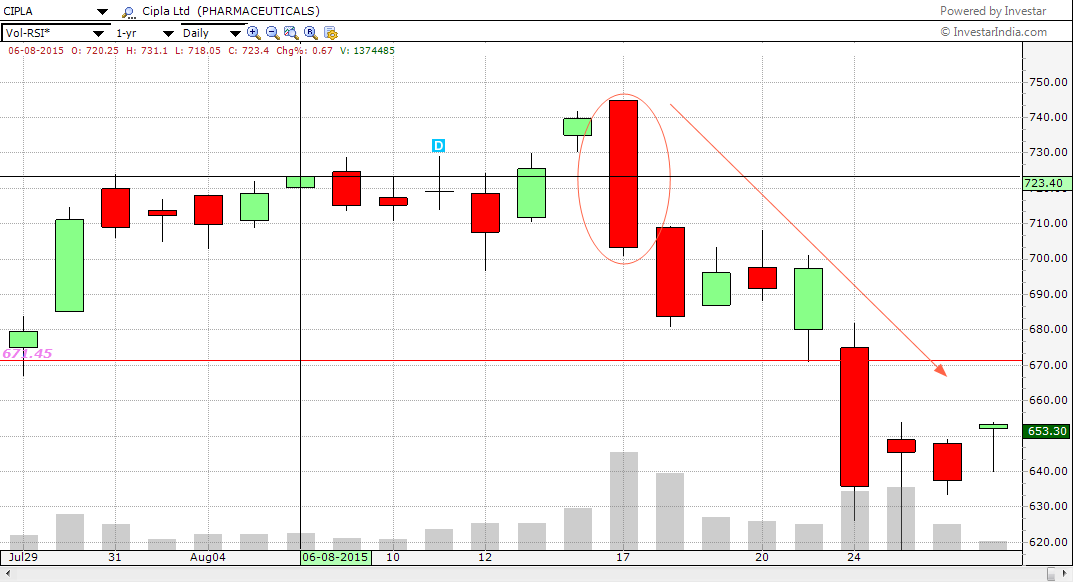
The bearish marubozu formation on 17.08.2015 in Cipla is another example worth mentioning.

 The candlestick formation was accompanied by high volumes.

Its body is longer than three times the size of the candle of the previous day and has negligible upper or lower shadow.

It has also formed a bearish engulfing pattern that day.

Also Read: OUTSIDE DAY: Bearish Engulfing and Bullish Engulfing Patterns

With all these confirmations along with the candle of the next day breaking down below the low of the marubozu, the bearish implications panned off the following days when the stock succumbed to the levels of 630 from the levels of 740 six days ago. 

Bottom Line

In this article, we have tried to help you to gain an understanding of the Marubozu Candlestick Pattern.

There are several other candlestick patterns. You may read about them here.

In order to know more about Financial Markets visit our website https://stockedge.com/

Feel free to give your feedback by writing to us in the comment box below.

Happy Learning!!

Tags: english
ShareTweetSend
Previous Post

Markets still in a nervous mode, Nifty loses more than 1%

Next Post

Dead Cat Bounce in Nifty?

Elearnmarkets

Elearnmarkets

Elearnmarkets (ELM) is a complete financial market portal where the market experts have taken the onus to spread financial education. ELM constantly experiments with new education methodologies and technologies to make financial education effective, affordable and accessible to all. You can connect with us on Twitter @elearnmarkets.

Related Posts

Technical Analysis in Stock Trading 1
Technical Analysis

Technical Analysis in Stock Trading

May 31, 2023
7.1k
The Ultimate guide to Trading Divergences 2
Technical Analysis

The Ultimate guide to Trading Divergences

May 26, 2023
1.1k
Trading Psychology: Guide to Master Your Mind in 5 Steps 3
Technical Analysis

Trading Psychology: Guide to Master Your Mind in 5 Steps

May 24, 2023
3.2k
Trading Psychology: 7 Keys to Successful Trading 4
Technical Analysis

Trading Psychology: 7 Keys to Successful Trading

May 22, 2023
3.1k

Comments 2

  1. Sushil Kumar says:
    3 years ago

    A vertical formative lesson about Marubozu candle,the given example in this lesson is perfect ,thank you

    Reply
  2. Sushil Kumar says:
    3 years ago

    A very informative lesson about Marubozu candle,the given example in this lesson is perfect ,thank you

    Reply

Leave a Reply Cancel reply

Your email address will not be published. Required fields are marked *

Follow Us

Facebook-f Twitter Instagram Linkedin-in Youtube Telegram

Register on Elearnmarkets

Continue your financial learning by creating your own account on Elearnmarkets.com

Register Free Account

Download App

Categories

  • Basic Finance
  • Derivatives
  • Financial Planning
  • Fundamental Analysis
  • Technical Analysis
  • Marketshala
  • Miscellaneous

Popular On Elearnmarkets

  • Market Superheroes:
  • Vivek Bajaj
  • Chetan Panchamia
  • Ashish Kyal
  • Premal Parekh
  • Abhijit Paul
  • Jegan
  • Sivakumar Jayachadran
  • Vishal Malkan
  • Jyoti Budhia
  • Vivek Gadodia
  • Vishal Mehta
  • Piyush Chaudhry
  • Santosh Pasi
  • Gomathi Shankar
  • Market Superheroes:
  • Vivek Bajaj
  • Chetan Panchamia
  • Ashish Kyal
  • Premal Parekh
  • Abhijit Paul
  • Jegan
  • Sivakumar Jayachadran
  • Vishal Malkan
  • Jyoti Budhia
  • Vivek Gadodia
  • Vishal Mehta
  • Piyush Chaudhry
  • Santosh Pasi
  • Gomathi Shankar
  • Courses:​
  • Options Trading
  • Dow Theory
  • Momentum Trading
  • Stock Investing
  • Stock Market for Beginners
  • Harmonic Chart Patterns
  • Algo Trading
  • Elliot Wave Theory
  • Advanced Excel
  • Cryptocurrency
  • NSE Certification Course
  • Courses:​
  • Options Trading
  • Dow Theory
  • Momentum Trading
  • Stock Investing
  • Stock Market for Beginners
  • Harmonic Chart Patterns
  • Algo Trading
  • Elliot Wave Theory
  • Advanced Excel
  • Cryptocurrency
  • NSE Certification Course
  • Webinars:
  • Bank Nifty Scalping
  • Intraday Trading Strategies
  • Options Trading Strategies
  • Options selling
  • Price Action
  • Relative Strength
  • Tax Planning
  • Options Buying
  • Growth Stocks
  • Portfolio Management
  • Relative Strength Index
  • Risk Management
  • Renko Charts
  • Crude Oil
  • Traders Psychology
  • Moving Average
  • Multibagger Stocks
  • Free Learning Modules:
  • Intraday Trading
  • Options Scalping
  • Swing Trading
  • Financial Modelling
  • RSI Indicator
  • Bollinger Bands
  • Pricing of Futures
  • Personal Finance
  • Initial Public Offerings (IPO)
  • Value Investing
  • Technical Indicators
  • Candlesticks
  • Chart Patterns
  • Option Greeks
  • ELSS Funds
  • Banking and Insurance
  • Real Estate
  • Gold
  • Book Summaries:
  • Rich Dad Poor Dad
  • Psychology of Money
  • The Intelligent Investor
  • The Richest Man in Babylon
  • Think and Trade Like a Champion
  • Value Investing and Behavioural Finance
  • Trading in the Zone
  • Learn to Earn
  • Book Summaries:
  • Rich Dad Poor Dad
  • Psychology of Money
  • The Intelligent Investor
  • The Richest Man in Babylon
  • Think and Trade Like a Champion
  • Value Investing and Behavioural Finance
  • Trading in the Zone
  • Learn to Earn
  • Tools:
  • CAGR Calculator
  • SIP Calculator
  • eLearnOptions
  • Future Value Calculator
  • Present Value Calculator
  • Atal Pension Yojana
  • Cost of Delay Calculator
  • Become a Crorepati
  • Tools:
  • CAGR Calculator
  • SIP Calculator
  • eLearnOptions
  • Future Value Calculator
  • Present Value Calculator
  • Atal Pension Yojana
  • Cost of Delay Calculator
  • Become a Crorepati

© 2023 Elearnmarkets. All Rights Reserved

  • Visit Elearnmarkets
  • Courses
  • Webinars
  • Financial Guides
  • Get Free Counselling
  • Visit Elearnmarkets
  • Courses
  • Webinars
  • Financial Guides
  • Get Free Counselling

Get Elearnmarkets App

No Result
View All Result
  • Article Categories
    • Basic Finance
    • Derivatives
    • Financial Planning
    • Fundamental Analysis
    • Technical Analysis
    • Marketshala
    • Miscellaneous
  • Language
    • Hindi
    • Bengali
    • English
  • Courses
  • Webinars

© 2020 Elearnmarkets All Rights Reserved