Elearnmarkets - Financial Market Learning
  • Categories
    • Basic Finance
    • Derivatives
      • Futures
      • Options
    • Financial Planning
    • Fundamental Analysis
    • Technical Analysis
    • Marketshala
    • Miscellaneous
  • Language
    • English
    • Hindi
    • Bengali
No Result
View All Result
  • Courses
  • Webinars
  • Stories
Elearnmarkets - Learn Stock Market, trading, investing for Free
No Result
View All Result
Home Miscellaneous
Hourly Chart

Market reacts with Union Budget corrects approx. 180 points

Elearnmarkets by Elearnmarkets
September 11, 2023
in Miscellaneous
Reading Time: 3 mins read
2
181
VIEWS
Share on FacebookShare on XShare on WhatsApp

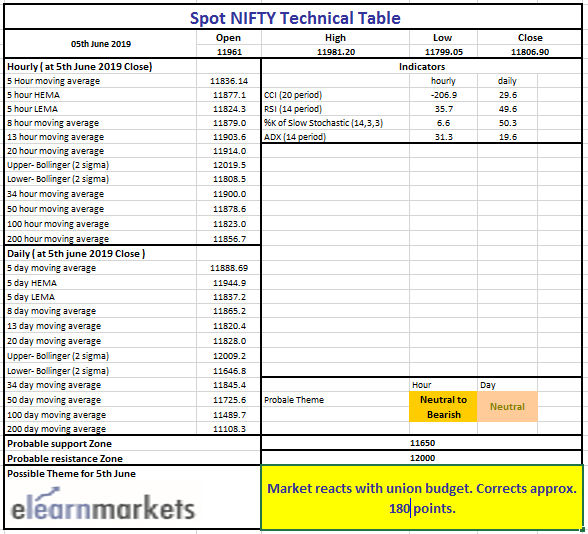
Market closes on a negative note with Union Budget announcement. As per the latest price action of last few days, we have seen the market was making indecisive candles. Today the market started in green but eventually as the budget progressed Nifty slides down. 

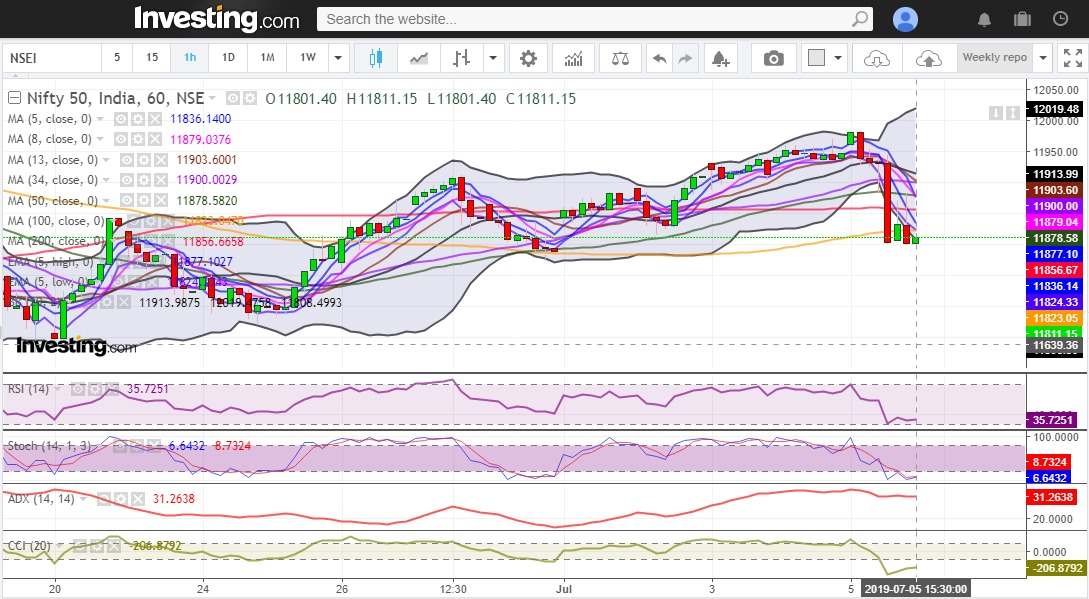
Hourly Technical: On the Hourly chart, the index closed below the 200MA and others moving averages are also trading above the price. So a short term negative sentiment might take place in next trading hours. 

Indicator RSI is trading at 35 level, Stochastic is below 10, ADX is above the 30 mark and the CCI is below the -200 level. 

So there is weakness in the price. But due to sudden drop in price and, there could be a short term pullback towards the mean. 

On the upside, the short term resistance would be at 11900 levels and if the price slides further 11750 would be the immediate support level.

Nifty 50 hourly technical showing short term negative sentiments
(Hourly Chart)

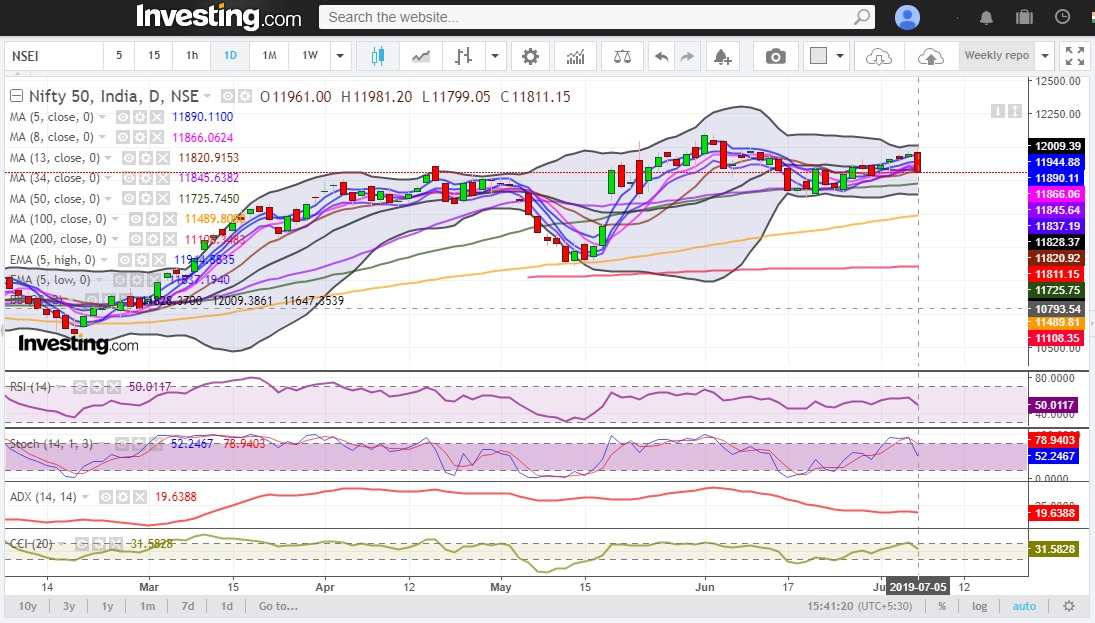
Daily Technical: The index has made a bearish Marubozu candle in the daily chart. 11985 level worked as a resistance today and 11800 has been the support for the index. 

On the technical side, RSI is standing at its 50 level. Stochastic is also trading approx. 50 region, ADX is below 20 and the CCI is at 30 Mark.

So overall, these cannot be termed as a weakness. But in case price falls further, 50MA (presently trading at approx. 11725.74) and 100MA (presently trading at approx.11489.80) likely to act as a support.

RelatedPosts

Binary Options Trading

Tips for Successful Binary Options Trading

September 29, 2022
3.2k
5 Simple Ways to Get Into Forex Trading for Beginners 3

5 Simple Ways to Get Into Forex Trading for Beginners

September 13, 2023
12.1k
Top 11 Factors to consider for taking a Personal Loan 4

Top 11 Factors to consider for taking a Personal Loan

August 29, 2022
1.4k
Market reacts with Union Budget corrects approx. 180 points 1
(Daily Chart)

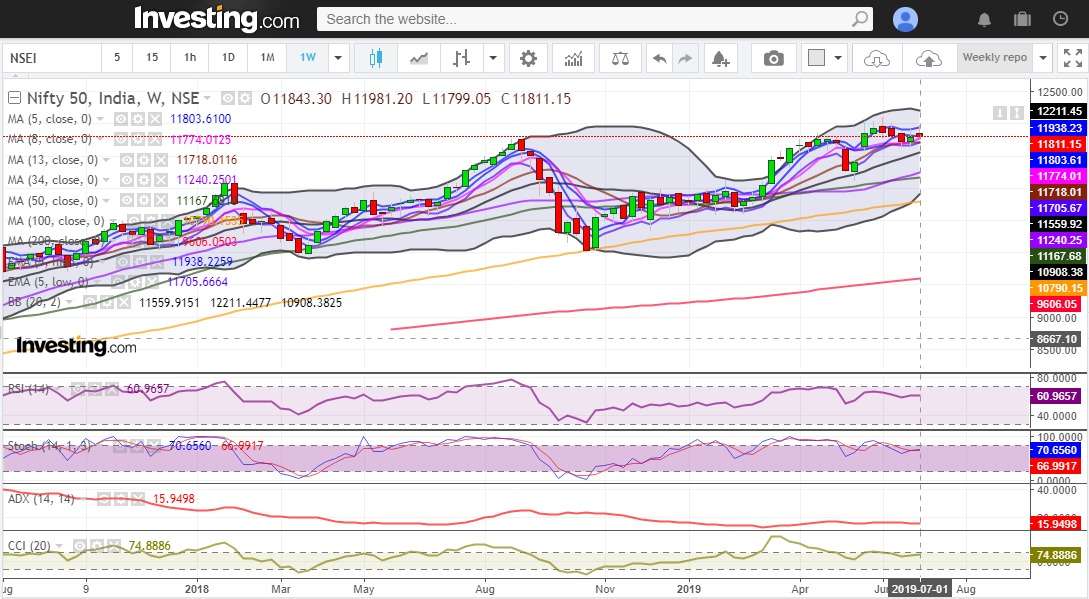
Weekly Technical: The index has formed a shooting start formation in the weekly chart. So technically, breaching the low (approx.. 11799.05) might infuse some negative momentum. 

Technical indicators, RSI is trading at 60 level, Stochastic is at 70 mark, ADX is at 15 and the CCI is above the 50Mark.

So, no sign of strong correction from the indicator side. Only the price is suggesting possible reversal. In case price start falling the support would be at mid Bollinger line (trading at approx..11559.91 level). If the weakness extends, 11250 levels will also act as a potential support zone. On the contrary, if there is any pullback takes place resistance would be at 11900-11950 level.

Market reacts with Union Budget corrects approx. 180 points 2
(Weekly Chart)

You can use StockEdge app to get cutting edge over others in both short term trading and investing. Here you not only get data at one particular place but can also create your own combination scans based on your own technical and fundamental parameter. See the video below to know about various features in StockEdge app.

Nifty Technical Chart

Tags: englishmarket reportnifty reportnifty weekly reportstock market reportstock market weekly reportweekly market reportweekly report
ShareTweetSend
Get Kotak Offer Get Kotak Offer Get Kotak Offer
Previous Post

Factors that drive Cyclical Industry

Next Post

Difference between the Ex-date and Record date in Stock Markets

Elearnmarkets

Elearnmarkets

Elearnmarkets (ELM) is a complete financial market portal where the market experts have taken the onus to spread financial education. ELM constantly experiments with new education methodologies and technologies to make financial education effective, affordable and accessible to all. You can connect with us on Twitter @elearnmarkets.

Related Posts

Binary Options Trading
Miscellaneous

Tips for Successful Binary Options Trading

September 29, 2022
3.2k
5 Simple Ways to Get Into Forex Trading for Beginners 5
Miscellaneous

5 Simple Ways to Get Into Forex Trading for Beginners

September 13, 2023
12.1k
Top 11 Factors to consider for taking a Personal Loan 6
Miscellaneous

Top 11 Factors to consider for taking a Personal Loan

August 29, 2022
1.4k
Term Plan with or Without Maturity Benefits - What's the Difference? 7
Miscellaneous

Term Plan with or Without Maturity Benefits – What’s the Difference?

September 12, 2022
319

Comments 2

  1. Alex says:
    4 years ago

    Nice article, thanks for sharing!

    Reply
    • Sakshi Agarwal says:
      4 years ago

      Hi,

      Thank you for reading!

      For receiving updates on our new posts please register on our blog page!

      Keep Reading!

      Reply

Leave a Reply Cancel reply

Your email address will not be published. Required fields are marked *

Elearnmarkets Logo

Follow Us

Facebook-f Twitter Instagram Linkedin-in Youtube Telegram

Register on Elearnmarkets

Continue your financial learning by creating your own account on Elearnmarkets.com

Register Free Account

Download App

Playstore logo
Download on app store

Categories

  • Basic Finance
  • Derivatives
  • Financial Planning
  • Fundamental Analysis
  • Technical Analysis
  • Marketshala
  • Miscellaneous

Popular On Elearnmarkets

  • Market Superheroes:
  • Vivek Bajaj
  • Chetan Panchamia
  • Ashish Kyal
  • Premal Parekh
  • Abhijit Paul
  • Jegan
  • Sivakumar Jayachadran
  • Vishal Malkan
  • Jyoti Budhia
  • Vivek Gadodia
  • Vishal Mehta
  • Piyush Chaudhry
  • Santosh Pasi
  • Gomathi Shankar
  • Market Superheroes:
  • Vivek Bajaj
  • Chetan Panchamia
  • Ashish Kyal
  • Premal Parekh
  • Abhijit Paul
  • Jegan
  • Sivakumar Jayachadran
  • Vishal Malkan
  • Jyoti Budhia
  • Vivek Gadodia
  • Vishal Mehta
  • Piyush Chaudhry
  • Santosh Pasi
  • Gomathi Shankar
  • Courses:​
  • Options Trading
  • Dow Theory
  • Momentum Trading
  • Stock Investing
  • Stock Market for Beginners
  • Harmonic Chart Patterns
  • Algo Trading
  • Elliot Wave Theory
  • Advanced Excel
  • Cryptocurrency
  • NSE Certification Course
  • Courses:​
  • Options Trading
  • Dow Theory
  • Momentum Trading
  • Stock Investing
  • Stock Market for Beginners
  • Harmonic Chart Patterns
  • Algo Trading
  • Elliot Wave Theory
  • Advanced Excel
  • Cryptocurrency
  • NSE Certification Course
  • Webinars:
  • Bank Nifty Scalping
  • Intraday Trading Strategies
  • Options Trading Strategies
  • Options selling
  • Price Action
  • Relative Strength
  • Tax Planning
  • Options Buying
  • Growth Stocks
  • Portfolio Management
  • Relative Strength Index
  • Risk Management
  • Renko Charts
  • Crude Oil
  • Traders Psychology
  • Moving Average
  • Multibagger Stocks
  • Free Learning Modules:
  • Intraday Trading
  • Options Scalping
  • Swing Trading
  • Financial Modelling
  • RSI Indicator
  • Bollinger Bands
  • Pricing of Futures
  • Personal Finance
  • Initial Public Offerings (IPO)
  • Value Investing
  • Technical Indicators
  • Candlesticks
  • Chart Patterns
  • Option Greeks
  • ELSS Funds
  • Banking and Insurance
  • Real Estate
  • Gold
  • Book Summaries:
  • Rich Dad Poor Dad
  • Psychology of Money
  • The Intelligent Investor
  • The Richest Man in Babylon
  • Think and Trade Like a Champion
  • Value Investing and Behavioural Finance
  • Trading in the Zone
  • Learn to Earn
  • Book Summaries:
  • Rich Dad Poor Dad
  • Psychology of Money
  • The Intelligent Investor
  • The Richest Man in Babylon
  • Think and Trade Like a Champion
  • Value Investing and Behavioural Finance
  • Trading in the Zone
  • Learn to Earn
  • Tools:
  • CAGR Calculator
  • SIP Calculator
  • eLearnOptions
  • Future Value Calculator
  • Present Value Calculator
  • Atal Pension Yojana
  • Cost of Delay Calculator
  • Become a Crorepati
  • Tools:
  • CAGR Calculator
  • SIP Calculator
  • eLearnOptions
  • Future Value Calculator
  • Present Value Calculator
  • Atal Pension Yojana
  • Cost of Delay Calculator
  • Become a Crorepati

© 2023 Elearnmarkets. All Rights Reserved

  • Visit Elearnmarkets
  • Courses
  • Webinars
  • Financial Guides
  • Get Free Counselling
  • Visit Elearnmarkets
  • Courses
  • Webinars
  • Financial Guides
  • Get Free Counselling

Get Elearnmarkets App

No Result
View All Result
  • Article Categories
    • Basic Finance
    • Derivatives
    • Financial Planning
    • Fundamental Analysis
    • Technical Analysis
    • Marketshala
    • Miscellaneous
  • Language
    • Hindi
    • Bengali
    • English
  • Courses
  • Webinars
  • Stories

© 2020 Elearnmarkets All Rights Reserved

Guide Book on Investing with ₹ 5000
Learn about the Basics of Investments and Finance in this Ebook.
Download Now