When trading in the stock market we should not only look at whether the market is trending or consolidating but we should also deal with volatility.
Thus, it is important for the traders to understand the volatility indicators which can help them to trade more effectively.
Volatile periods in the stock markets can create big swings in the markets which can make it difficult for the traders to trade.
Extreme volatility can be seen in the market when certain news comes which are extreme.
High Volatility can be seen when the market is trending and low volatility occurs during the consolidation phase of the market.
In this blog we will discuss the top 5 Volatility Indicators that will help the traders in analysing volatility in the market:
What are Volatility Indicators?
Volatility Indicators help in gauging the periods of high and low volatility in the particular stocks or market as a whole.
The big swings created by the volatility can provide good trading opportunities for traders
In order to know the periods of high and low volatility in the market, traders can use volatility indicators which will help them in analysing these periods.
There are certain widely used volatility indicators that help traders to know when the volatility is high or low in the stock which we will be discussing next.
Top 5 Volatility Indicators
Below are the Top 5 Volatility Indicators that traders should look at when analysing the market:
1. Bollinger Bands
Bollinger Bands consist of 3 bands: the upper, lower and middle bands.
The middle band is the 20 days or bars moving average, the upper band is +2 Standard Deviation and the lower band is the -2 Standard Deviation of the middle band.
When the volatility in the market increases then these bands expand, and when the volatility decreases then these bands contract.
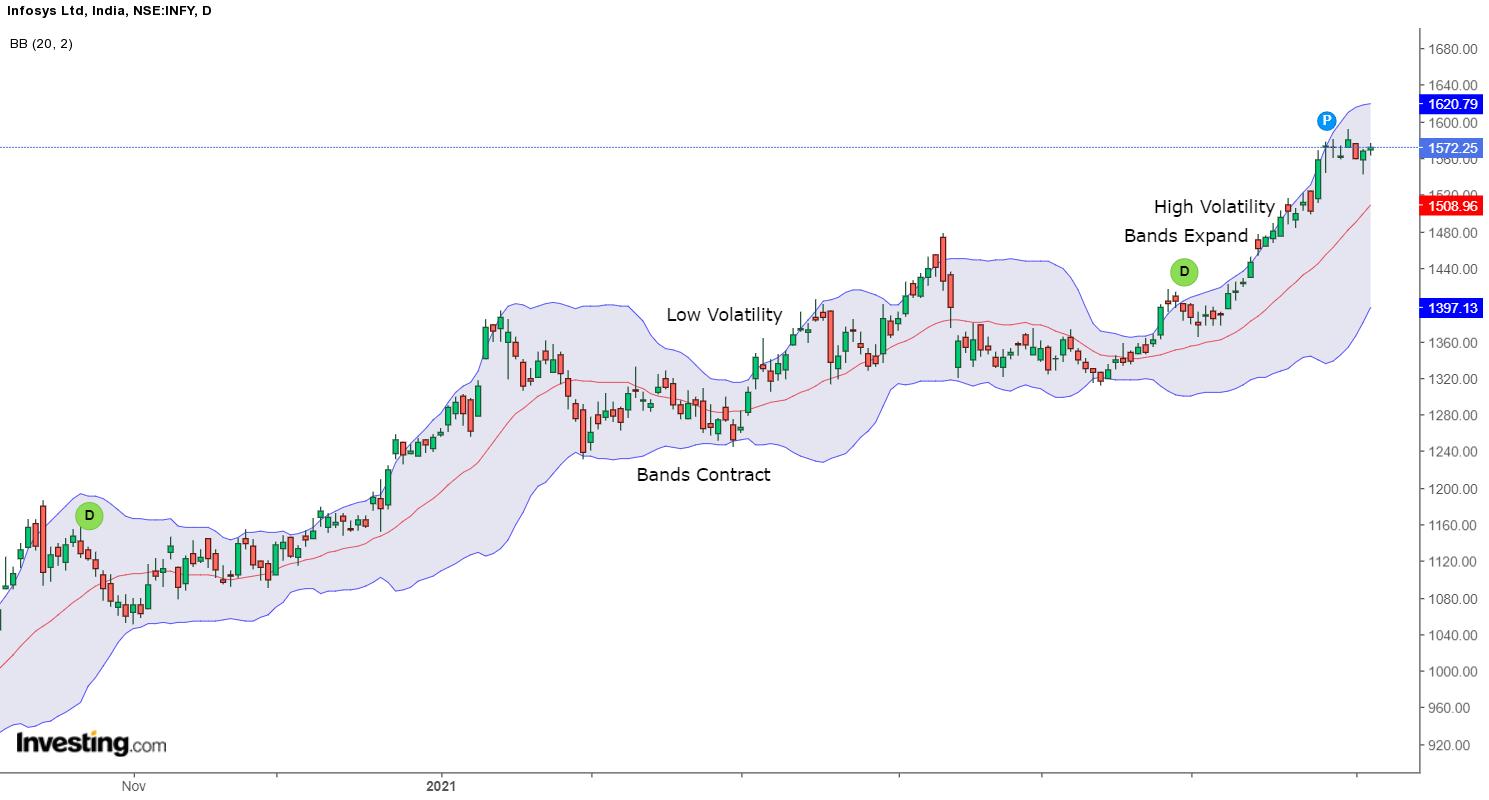
Traders can trade with the Bollinger bands when the prices break out from either side of the upper or lower bands after the low volatility or consolidation phase.
2. Keltner Channel
Keltner Channels is a volatility-based indicator that is placed on either side of the stock’s price and helps in determining the direction of a trend.
The Keltner channel uses the average-true range (ATR) with breaks above or below the top and bottom barriers that signals a continuation in the trend.
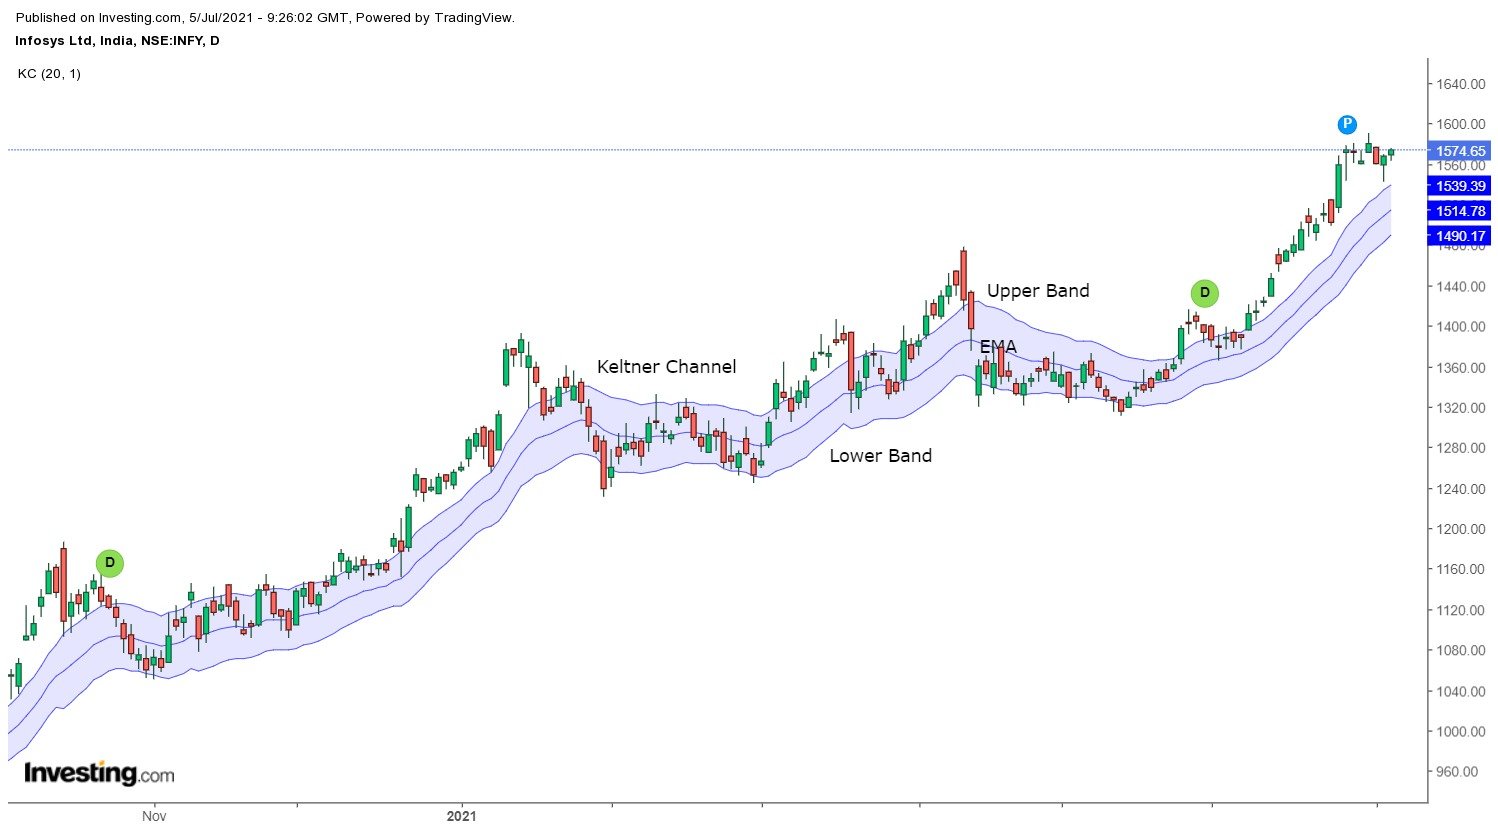
The middle line is an exponential moving average (EMA) of the price. The upper band is usually set two times the ATR above the EMA, and the lower band is set two times the ATR below the EMA.
These bands generally expand and contract as volatility which is measured by ATR expands and contracts.
3. Donchian Channel
Donchian Channels is a popular volatility indicator determining volatility in the market prices.
This indicator is created by three lines that are generated by moving average calculations.
It consists of three bands: upper and lower bands around a median band.
The upper band shows the highest price of security whereas the lower band shows the lowest price of a security over a specific period, usually 4 weeks.

The area between the upper and lower bands is the Donchian Channel.
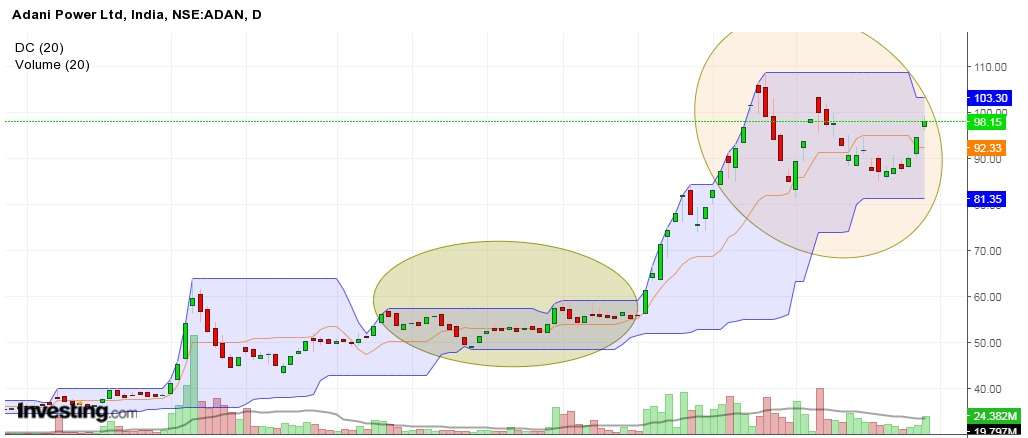
Traders can enter a buy trade when the prices break from the upper band and they can enter a short position when the prices break from the lower band.
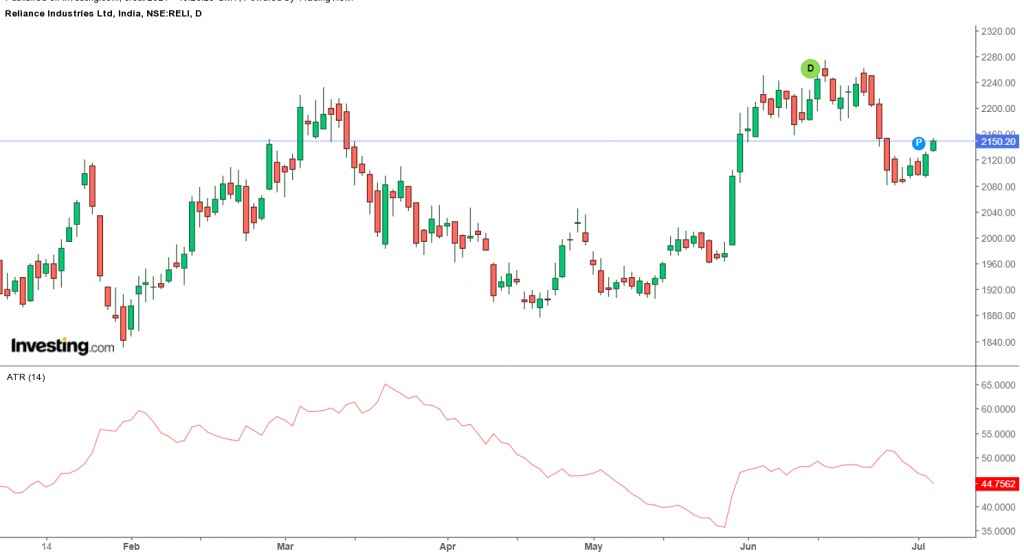
4. Average True Range (ATR)
The ATR measures the true range of a particular number of price bars, usually 14.
ATR is a pure volatility measure that does not necessarily indicate a trend. Sometimes volatile price movement can occur inside a choppy market during an important news event.
The best way of using the ATR is as an indication of the change in the market’s nature.
A rise in ATR indicates higher trading ranges and thus an increase in volatility. Whereas low readings from the ATR indicate periods of quiet or uneventful trading.
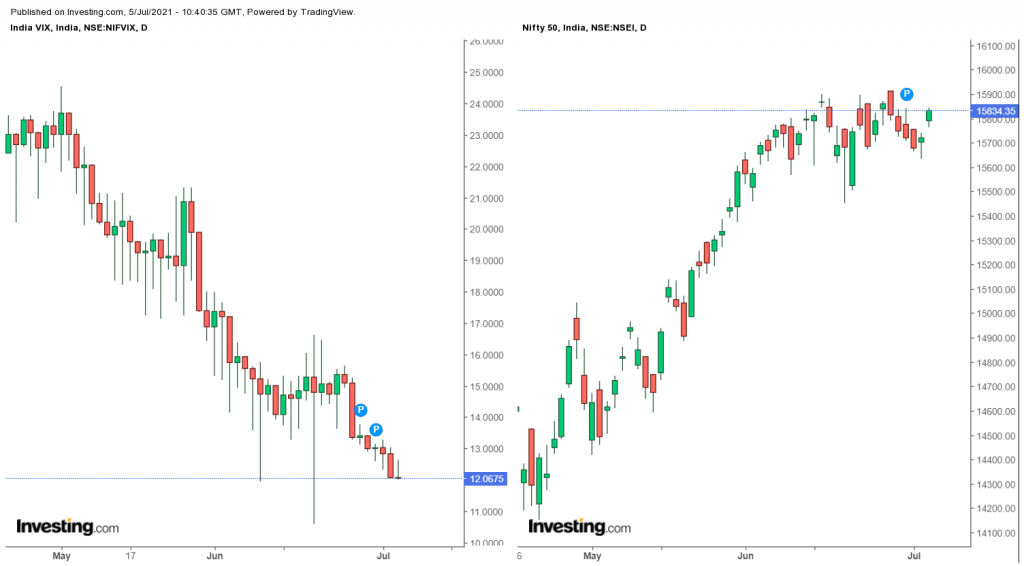
5. India VIX
Volatile Index is an index used to measure the near-term volatility expectations of the markets.
The volatility index of India is known as India Vix launched by the National Stock Exchange (NSE) in 2008.
India Vix shows the volatility of Indian markets from the perception of the investors.
When India Vix is high, it indicates higher volatility expectations which means a significant change in Nifty and similarly lower value of India Vix indicates lower volatility expectations which means minimal change in Nifty.
India Vix has an inverse relationship with Nifty. When India Vix falls, Nifty rises and when India Vix rises, then Nifty falls.
Using Volatility Indicators in StockEdge
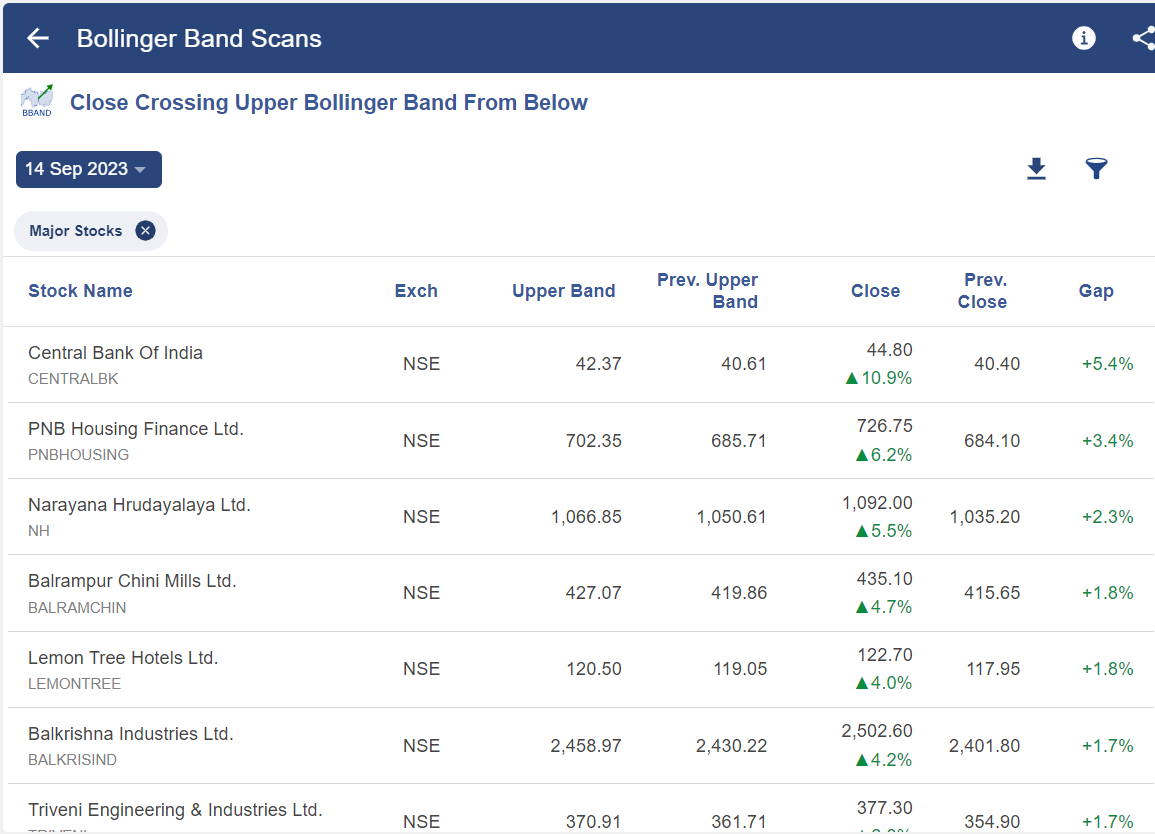
There are technical volatilty indicator scans available in StockEdge through which one can filter out stocks as shown below:
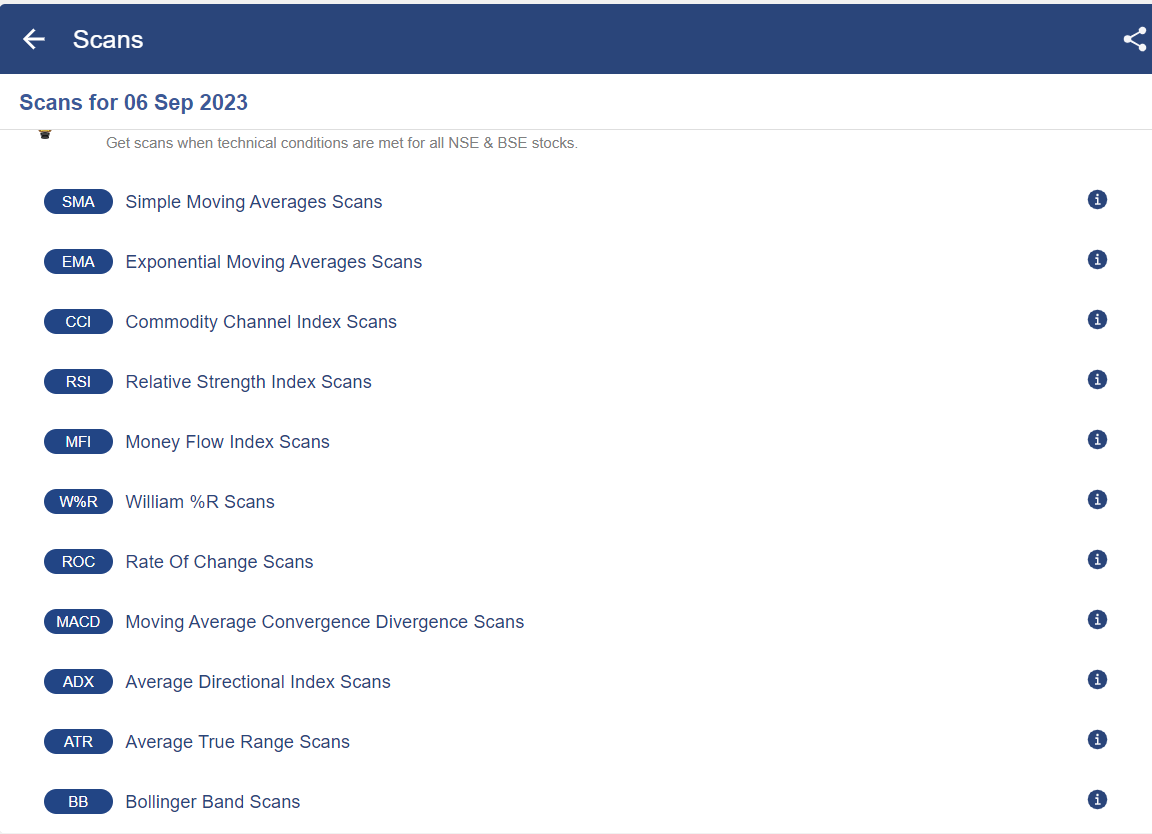
After clicking on any of the technical indicator scans one will get a sub-list of scans:
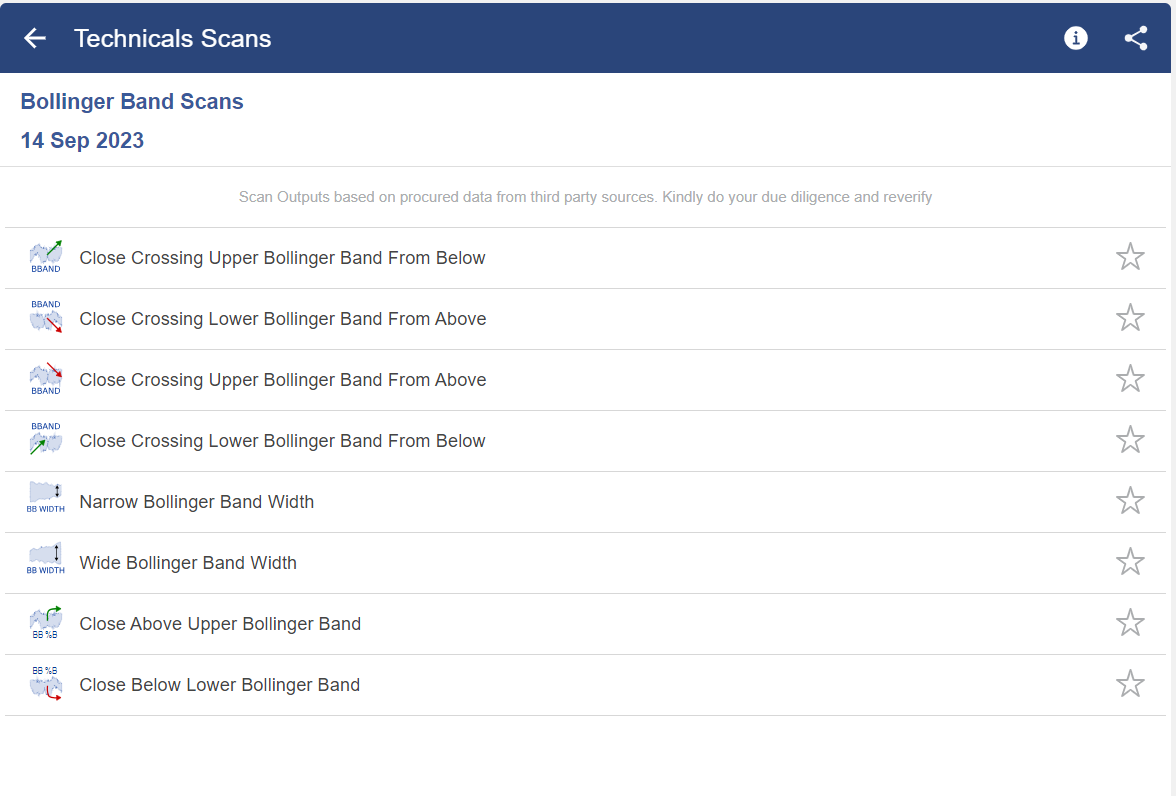
You get a list of stocks that fulfil the criteria:
Bottomline
Volatility indicators can be excellent tools for identifying market transitions from high periods of volatility to low periods of volatility. These indicators when combined with other trending indicators such as momentum or technical indicators can form the basis of a flexible trading system.
Frequently Asked Questions (FAQs)
Which indicator is best for volatility?
Some of the best volatility indicators include Bollinger Bands, Average True Range, and Donchian Channel.
What indicator tracks volatility?
The volatility over a certain time period is tracked using the Average True Range (ATR) indicator. A higher ATR number indicates greater market volatility, whereas a lower ATR indicates lower market volatility. It moves up or down depending on how pronounced price changes are for an FX pair.
Which indicator is best for the Volatility 75 index?
To spot patterns and place lucrative trades in the volatile Volatility 75 Index market, use the RSI indicator. To spot strong market movements, use the RSI with period 14 and levels 50 and 50, then check with the 21 EMA before placing buy transactions.
What is the indicator of volatility in intraday?
Bollinger bands show how volatile the market is. Bollinger bands come in three varieties: a middle bang that is a 20-day simple moving average, an upper bang that is +2 standard deviations, and a lower band that is -2 standard deviations.


I have become a regular visitor 🙂 Great Vivek
Hi,
We really appreciated that you liked our blog.
Keep Reading!!
thanks for sharing
Hi,
We really appreciated that you liked our blog.
Keep Reading!!
Very Good Content. Easily understood.
Hi,
We really appreciated that you liked our blog.
Keep Reading!