Key Takeaways:
- Opening Marubozu forms when price opens at the high (bearish) or low (bullish) of the day and moves strongly in one direction
- It shows instant dominance by bulls or bears right from market open, often seen in intraday volatile moves
- Closing Marubozu forms when price closes at the high (bullish) or low (bearish) of the day
- It signals strong sentiment throughout the session with likely continuation next day
- Both patterns are rare but powerful, especially with volume and support/resistance confirmation
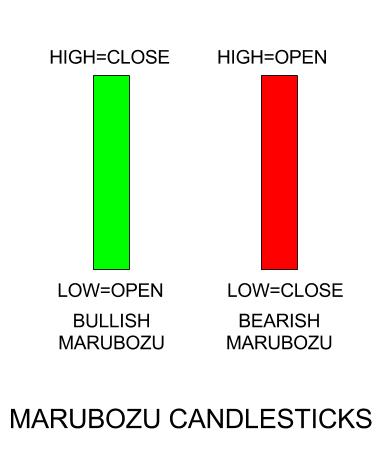
A Marubozu is a hard-to-miss candlestick with a full, long body and barely any shadows. This solid body indicates a strong movement in any particular direction may it be upside or downside.
When a bullish green or white candlestick is formed, it indicates that the moment the price opened, they traded higher and higher, finally closing in the middle of an attempt to rise further.
In simple terms, the day’s low is formed at the opening price itself and the day’s high is formed when the trading session ends. Similarly, in a Bearish red or black Marubozu, the opening and high price are the same, whereas the closing occurs at the close of the day.
What is Opening Marubozu?
Now, this a textbook perfect definition and a rather rare occurrence.
A perfect Marubozu is extremely rare on a daily or weekly chart, however, in the intraday charts, they may be observed during periods of very volatile and strong movements.
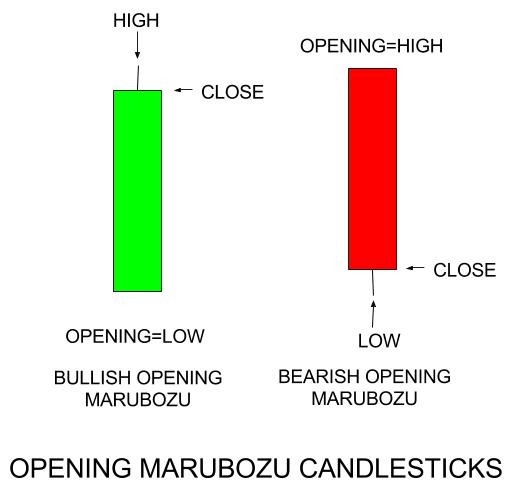
A more practical version of this Japanese candlestick is the Opening and Closing Marubozu. This candlestick pattern occurs when the opening price occurs at the high or low of the day.
When the opening price is equal to the high of the day, it is bearish and when it is at the low of the day it is bullish Marubozu.
It signifies that as soon as the opening bell rang, the bears or the bulls took charge and pushed the prices in the direction for the rest of the session.
In the case of a Bearish pattern, traders who have a long position do not get a chance to exit the trade as the price slips down without a breather, and in a bullish pattern, the bulls take charge as soon as the trading starts and any initial short trader would be badly stuck.
What is Closing Marubozu?
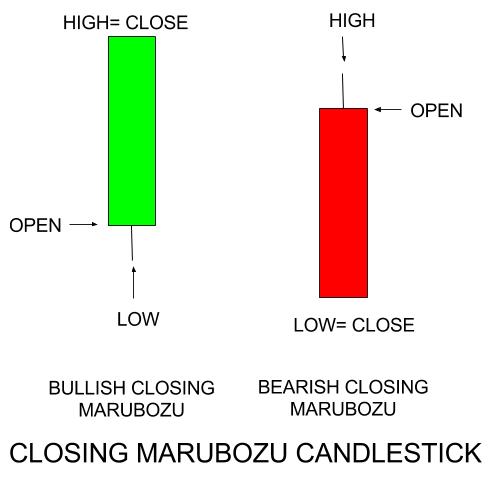
The closing candle is a stronger candlestick pattern. It is formed when the close price is equal to the high or the low of the day.

When the close price is equal to the low, then it is called bearish, and when the close is equal to the high, it is a bullish Marubozu.
It indicates that not only did the prices maintain the move in a single direction after initial jitters during the opening, in fact the participants maintained the sentiments till the end moment of the trading session.
Therefore, it is expected that when the trading session reopens, the price will continue moving in the direction of the close. It is, again, a rare pattern to observe.
Examples
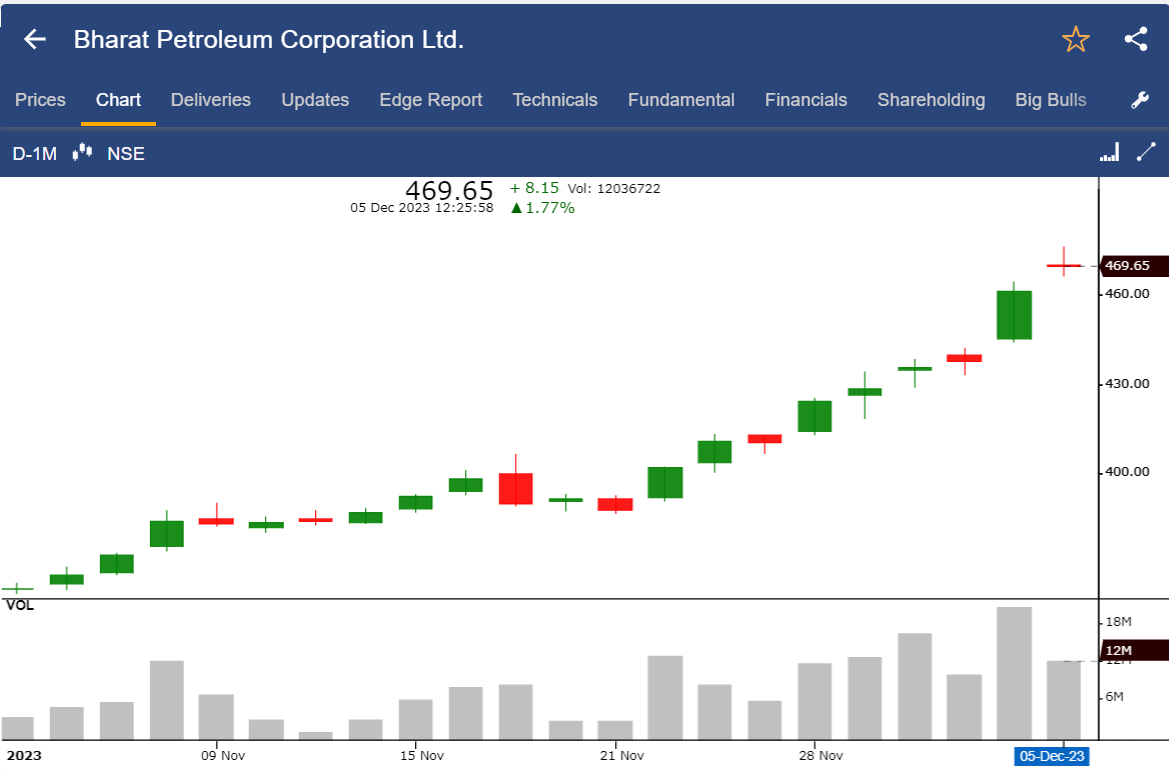
In the below chart of Bharat Petroleum Corporation Ltd., we can see the formation of the white candlestick, indicating that the uptrend is going to continue as shown below:
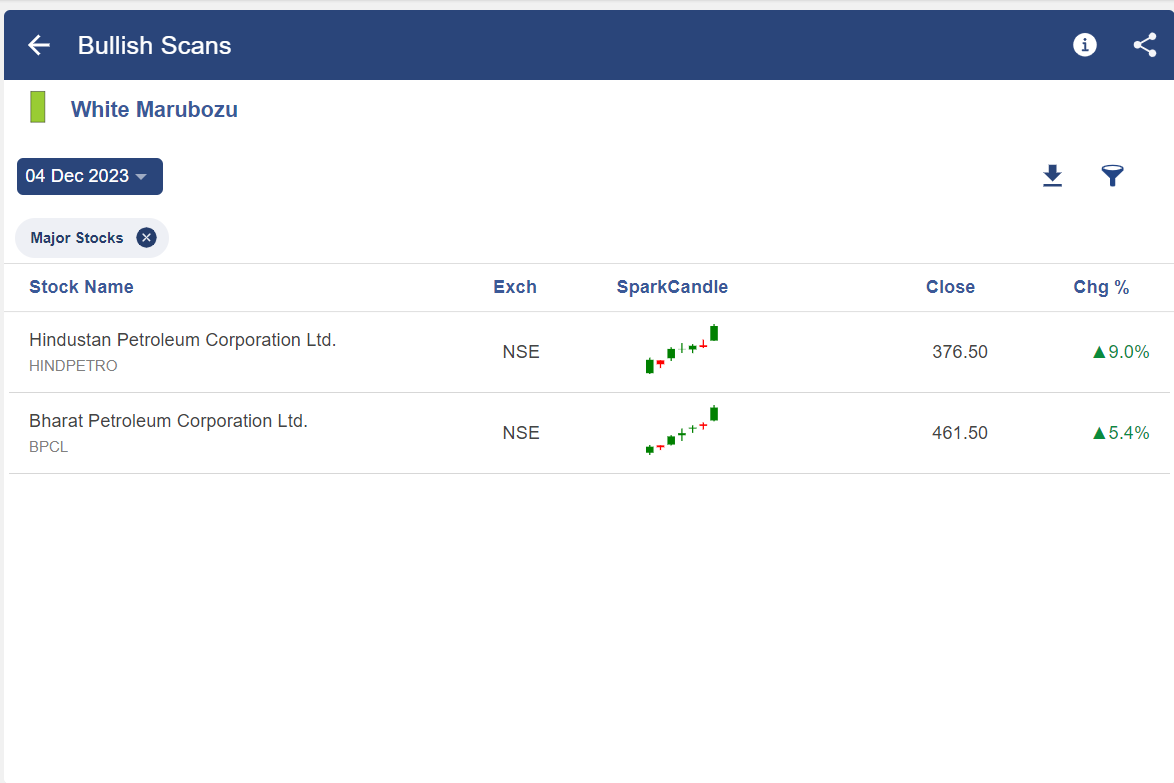
Using Marubozu Scan in StockEdge
With the help of StockEdge, we can find out in which stocks this candlestick is formed and filter out stocks accordingly, as shown below-
Bottomline
It is significant to remember that candles in both cases simply produced a signal regarding the prognosis for future market action. In contrast to more potent reversal patterns that produce signals or cautions, this candle is typically simply employed to validate that the price action might persist in the same direction.
It is harder to trade this candlestick than, say, trading the hammer in terms of entry, taking profit, and stopping loss. The trading parts of this pattern are less evident, but it typically results in strong, one-sided candles that are simple to identify and explain.
Read More- All 35 Candlestick Chart Patterns in the Stock Market
Frequently Asked Questions (FAQs)
What does the Marubozu candlestick indicate?
When a certain stock is attracting so much buying interest that people are prepared to purchase it at any price during a trading session, it is indicated by this kind of Marubozu candlestick pattern. The price closes close to the high price as a result of this buying enthusiasm.
What is a Marubozu stock candle?
This Candlestick is a visually striking Japanese candlestick pattern that indicates a trading session in which there has been minimal price retracement and the asset has moved significantly higher or lower from the opening price.


