
52 Week High/Low Levels? Why are these levels so important to the trader who trade by analyzing technical charts?
The 52-week high/low levels are considered to be significant resistance/ support levels when we look at the technical charts for trading stocks in the stock market.
The 52-week high/low is the highest and lowest price of the stock within the past 52 weeks. These numbers are calculated on the daily closing share price. But remember, they do not show intraday highs or lows, which may be reached during a trading session.
Traders use 52-week high/low levels for many reasons, including as an indicator to determine how volatile the stock has been over the past year or if the stock is trending in one direction or the other.
So, in today’s blog, we will discuss the importance of 52 week high/low levels is and how to trade with the same:
What 52 week high/low levels mean?
Traders use these levels as a technical indicator for analyzing the current value of a stock and its future price movement.
Traders usually show an increased interest in a particular stock when its price is near the high or the low end of its 52-week price range. The range generally exists between the 52-week low and the 52-week high). These levels are based on the daily closing price of the stock.
One should not that often, a stock may break a 52-week high intraday, but it may end up closing below the previous 52-week high, thus going unrecognized.
This also applies when a stock makes a new 52-week low intraday but fails to close below the new 52-week low.
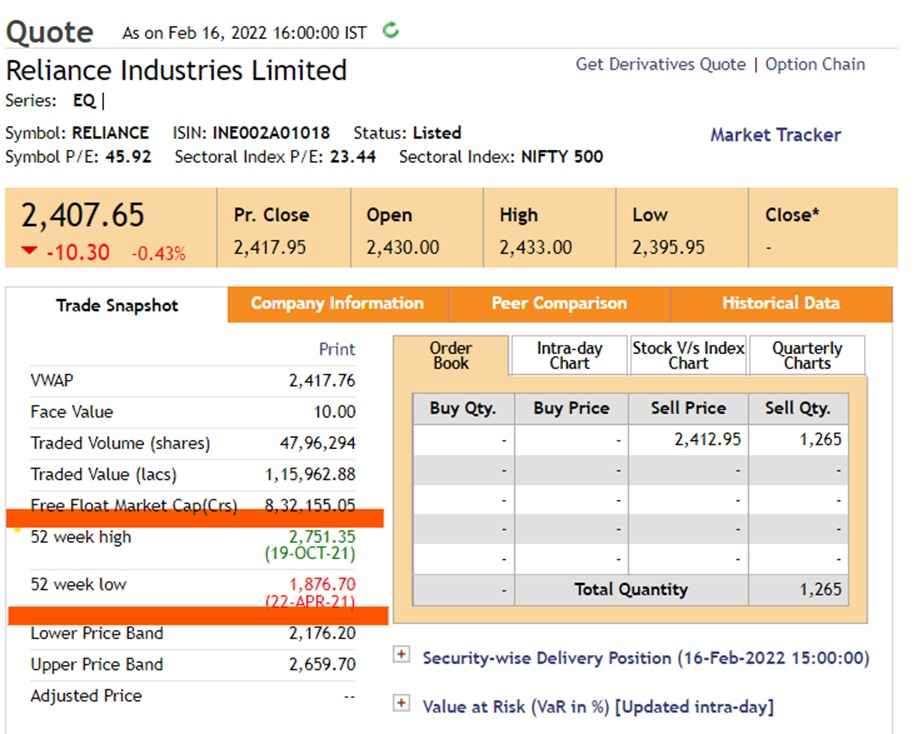
Many websites provide stock quotes with additional information, including the company’s market capitalization, the bid and ask prices, price-to-earnings ratio, the volume of shares traded and also the 52 week high/lows as shown below:
Now let us discuss how can we trade with this technical indicator:
How does this work?
The 52-week high/low helps us in predicting whether the ongoing trend will continue or reverse as explained below:
1. Reversal
When the stock price trades reach and close near its 52-week high, the traders expect that the price will trade lower in the future as the 52-week high is considered the resistance level.
As a result, many traders book their profits because they believe that the prices may reverse from the resistance level.
This applies to a 52-week low as well, where traders expect this to be a support level and expect it to rise.
Reversals can be an effective trading strategy. For example, if the price fails to break the 52 week high/low levels, then the traders can expect the prices to reverse from those levels as shown below:
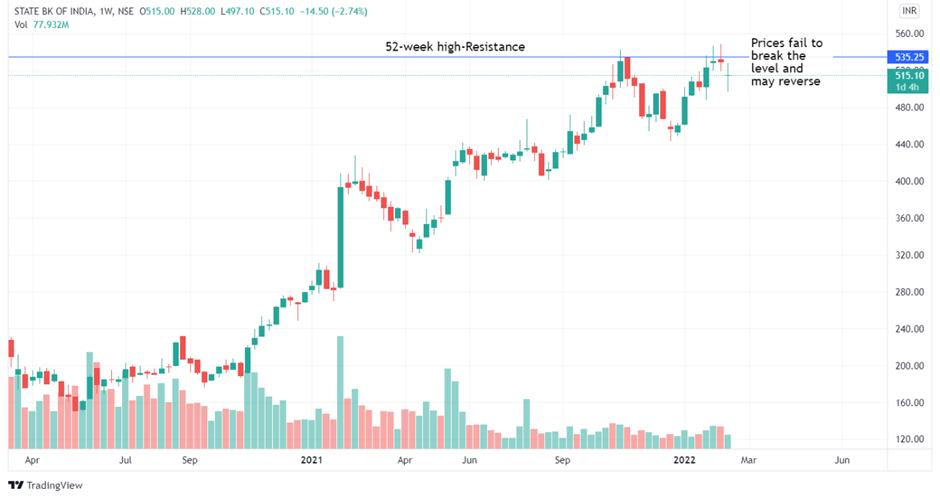
From the weekly chart of the State Bank of India, we can see how prices reverse back from their 52-week high level. In addition, we can also see the formation of Doji candlesticks at this level that shows uncertainty in the market, and the trend may reverse to the downtrend.
Traders should use this information and other technical indicators and volume data. We can use additional technical indicators for predicting reversal patterns, including the descending wedge or the rounding bottom.
If the reversal does not occur, one should put a stop-loss order to minimize the loss. However, many traders prefer to wait and watch and only enter once the reversal in trend becomes apparent.
You can also take our course on CERTIFICATION IN ONLINE TECHNICAL ANALYSIS to learn more about Technical Analysis
2. Trend Continuation
Other traders choose to buy or sell when a new 52-week high or low is reached or the stock breaks out from these levels.
One should also look at the volume of shares when a stock price crosses either the 52-week high or low mark. Usually, trading volume rises when the stock moves past the high or low mark, then falls.
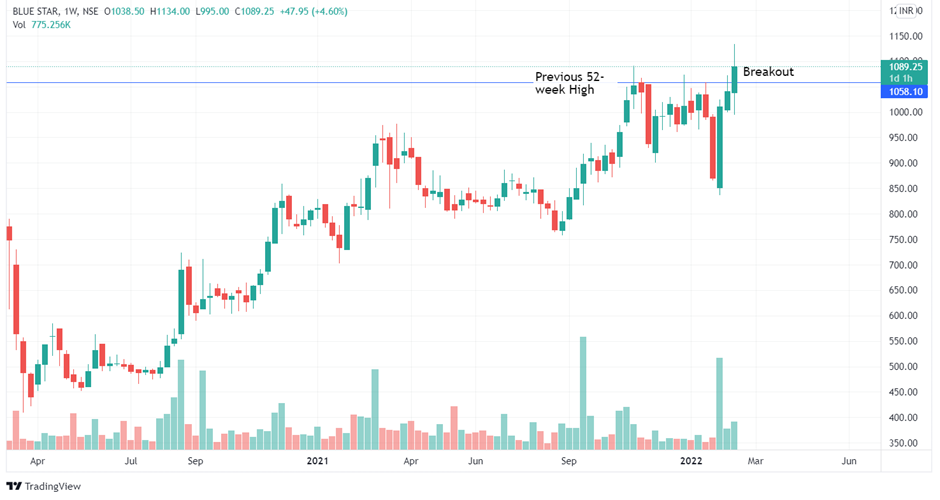
From the weekly chart of Blue Star Ltd., we can how the prices broke out from the previous 52 week high with an increase in volume, forming a new 52 week high and indicating trend continuation.
Particularly momentum investors pay attention to 52-week high/low marks. They believe that a stock market’s recent winners and losers will remain winners and losers in the near term. This strategy is known as “relative strength investing.”
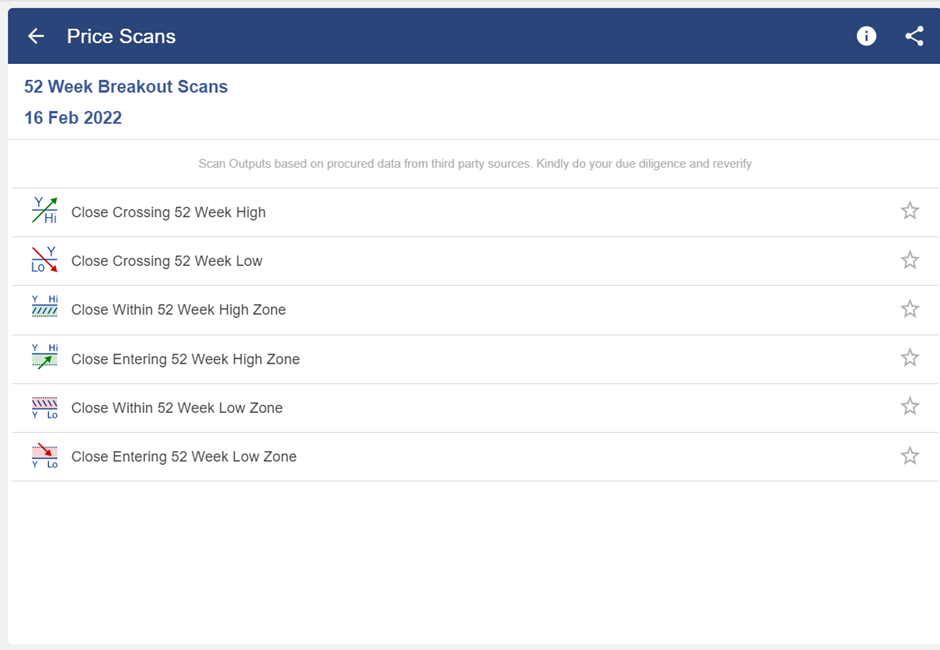
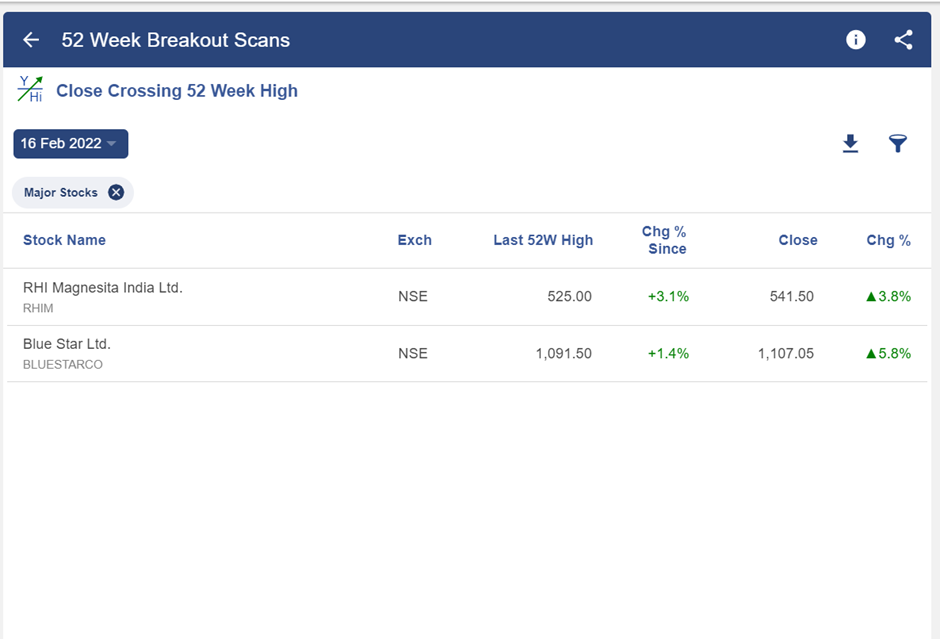
Identifying these levels with the help of StockEdge
There are many 52 week breakout scans in StockEdge that helps us in filtering stocks for our trading, as shown below:

After clicking on any of the above stocks, we can get a list of stocks satisfying that criteria as shown below:
Bottomline
Whether you are a momentum investor or not, reviewing a stock’s 52-week high and low prices can give you useful information. We hope you found this blog informative and use it to its maximum potential in the practical world. Also, show some love by sharing this blog with your family and friends and helping us in our mission of spreading financial literacy!
Happy Investing!


Very crucial and helpful content. Thanks Sir.
Hi,
We really appreciated that you liked our blog! Thank you for your feedback!
Keep Reading!
Keep sharing these type of informative articles. Thank you!!!