When you are trading in stocks, trends and patterns are crucial to making the right decisions. The trendline is the simplest yet the most effective tool in technical analysis. Trendlines allow traders to easily see market direction so that they can spot potential buy or sell signals. Particularly in the Indian market, where you’re dealing with lots of volatility and ambiguity, trading with trendlines is extremely helpful for developing trading techniques.
In this blog, we will discuss the basics of trading with trendlines, their definition, drawing, and application. If you apply these insights to your trading strategy, you’ll be able to better understand market moves and take better actions.
What Is a Trendline and How Does It Work?
Trendline is a basic technical tool that traders can use to visualize market movements. It’s a straight line on a price chart connecting two or more major price points. Trendlines depict how much the price is moving, either up (bullish), down (bearish), or sideways (range-bound). With trendlines, traders are able to see trends and support/resistance points and even foresee price reversals.
In India, where stock prices depend on various sources of information, including economic data, policies, and global events, trendlines make complicated price movements easy. For instance, if a stock has an upward trendline, such as Reliance Industries, then there’s regular buying interest, and if it has a downward trendline in a metal stock, then there’s ongoing selling pressure.
Trendlines work by reacting to the natural movements of the market and providing an account of how price action behaves. They are dynamic and move along with market changes, which is why they are more insightful than they are at static support and resistance levels.
Trendlines are sometimes combined with additional tools such as moving averages, Relative Strength Index or RSI, and volume indicators to maximize efficiency. Together, they present a complete picture of the market. This is very helpful for a trader to make informed choices. Trendlines, therefore, are essential for dealing with the intricacies of India’s stock market.
Types of Trendlines
Trendlines are classified by the direction of the trend in the market that they represent. Each kind has different implications for traders, particularly for the Indian stock exchange.
Upward Trendlines
Upward trendlines bridge higher lows in a price chart and signal an uptrend. They act as dynamic support levels, where the price tends to bounce back during corrections. This sort of trendline is bullish in nature and is typical in market rallies.
For example, if we look at Indian mid-cap stocks, the upward sloping trendline can signal robust buying pressure. Traders use these lines to find entry points during pullbacks.

Downward Trendlines
Downward sloping trendlines link lower highs in a price chart and represent a downtrend. These trendlines serve as support levels where the price will likely see selling action. They are bearish indicators, and they can guide traders to short-selling opportunities.
In the Indian market, down trendlines tend to occur in sectors going through correction or regulatory hurdles. The early identification of these trends can prevent traders from incurring losses.
Horizontal Trendlines
The horizontal trendlines are drawn between price points that have repeatedly been used as support or resistance. They’re also very common in sideways markets, where prices change within a range. These are trendlines that traders look for when the market will break out or break down.
In a consolidating stock, for instance, a horizontal trendline at resistance can act as a trigger to breakout if the price closes above it on strong volume.
Types of Trendlines and Their Differences
| Type of Trendline | Definition | Market Implications | Use Case in Indian Market |
| Upward Trendline | Connects higher lows, indicating an uptrend and acting as a support level. | Signals bullish momentum, suggesting entry points during pullbacks in uptrending stocks. | Seen in mid-cap stocks during market rallies, highlighting strong buying interest. |
| Downward Trendline | Connects lower highs, indicating a downtrend and acting as a resistance level. | Signals bearish momentum, indicating potential short-selling opportunities in downtrending stocks. | Observed in sectors undergoing corrections or facing challenges, aiding loss mitigation. |
| Horizontal Trendline | Drawn across price levels that repeatedly act as support or resistance in a sideways market. | Indicates consolidation, highlighting breakout or breakdown scenarios. | Common in consolidating stocks; breakout above resistance levels suggests new trends. |
How to Draw a Trendline?
A well-drawn trendline is an important metric for trend identification and trading decisions. Trendlines represent the price movements and can give you a sense of potential support and resistance levels. When you create an accurate trendline, your analysis will be reliable and useful. This is how to do it right:
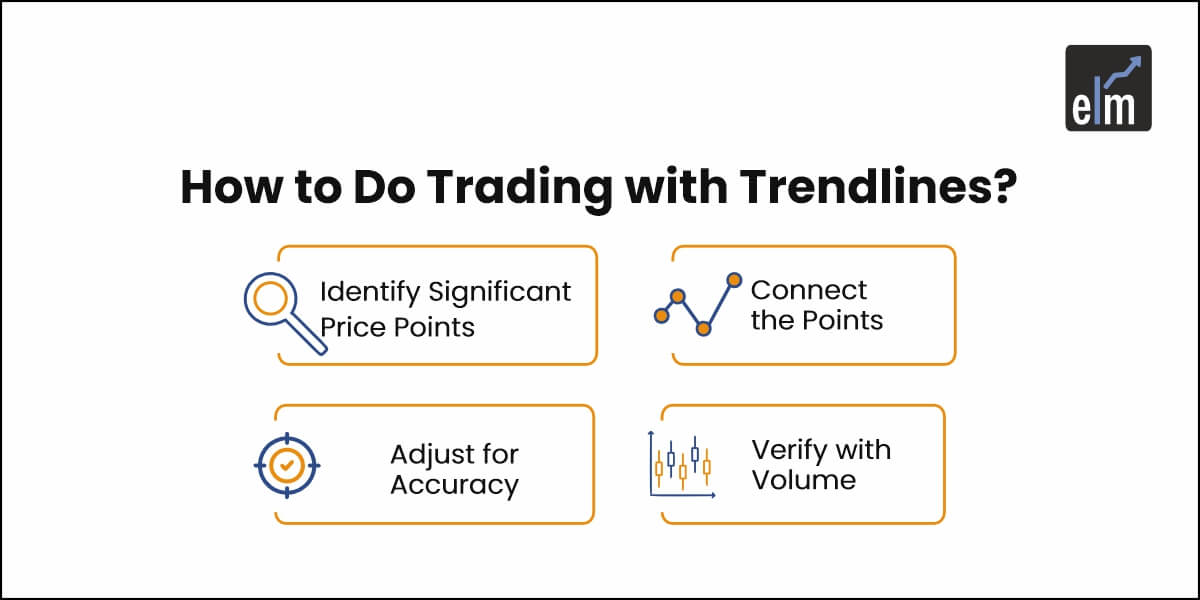
- Identify Significant Price Points
Start with two or more price points on the chart. If it is an upward trendline, link higher lows that indicate the bullish direction, and if it is a downward sloping trendline, link lower highs that indicate the bearish direction. In order to plot a horizontal trendline, you’ll need to see the places where prices have consistently reversed as support or resistance. - Connect the Points
Join the price points found using a line. Ensure the trendline touches as many price points as possible to enhance its validity. The line needs to be visually consistent with the trend and does not need to connect to unrelated data points. - Adjust for Accuracy
Track the trendline and adjust it regularly when market data fluctuate. A trendline that crosses more and more price points over time is stronger and more dependable for trendline analysis. - Verify with Volume
Study volume patterns to confirm the trendline’s significance. The presence of a valid trendline usually correlates with changes in the trading volume, which signals market sentiment and validates the trend.
Understand Breakout Trading with Trendlines
If you are thinking about how to use trendlines in trading, then you must know that trading trendline breakout is a very common technique to rely on. When the price moves beyond a trendline, it means that the market direction is changing, and it will trigger a breakout. This method is quite popular in the Indian market as it is very simple and productive.
Identifying Breakouts
- Upward Breakout: If the price is above a trendline that is downward, then bullish momentum is present. This tends to be a sign of an uptrend.
- Downward Breakout: If the price falls below an upward trendline, it indicates a downward trend and bearish movement.
Strategies for Trading Breakouts
- Immediate Entry: Traders can enter a position as soon as the breakout occurs as they expect momentum in the breakout’s direction. This is an aggressive tactic, but if the breakout is real, it’s very profitable.
- Retest Confirmation: The safer bet for trading with trendlines is to wait for the price to retest the trendline following the breakout. If the trendline holds as support or resistance, then traders can trade with greater confidence.
Examples in the Indian Market
Breakout trading is a broad trading trendline strategy that Indian traders use to find out how prices might move in various asset classes. When you pair trendline with other technical indicators, you’ll be able to find opportunities in stocks, indices, and commodities. Here are some use-case scenarios of breakout trading in India.
Stocks
In the Indian IT sector, a breakout above a downward trendline is the most common signal of the beginning of a rally. The shares of Infosys or TCS, for example, can show this trend in times of high-earning announcements or sector expansion, and this could present buying opportunities for traders.
Indices
A benchmark index, the Nifty 50, often presents breakout conditions. A breakout above resistance on a horizontal trendline can be indicative of an uptrend. This can be especially helpful when earnings seasons come around or after big policy announcements, which stimulate market sentiment.
Commodities
One of the most traded commodities in India is gold, which usually experiences breakouts above horizontal trendlines when economic uncertainty or demand is higher. These breakouts are often accompanied by rising volumes, which suggests that the market is bullish and has potential for investments.
Advantages of Trading with Trendlines
Trendlines are the foundation of technical analysis, and it is the simplest yet most effective way for traders to make sense of market behavior. They are very versatile and reliable, which makes them ideal for both beginners and more advanced traders. Here are some of the main benefits of trading with trendlines.
Simplicity
Trendlines are intuitive to draw and visualize. It just takes two important price points to get an easy-to-understand visual representation of trends in the market. This simplicity is why they are the best option for a beginner trader starting out with learning technical analysis.
Versatility
Trendlines can be used for any asset class, such as stocks, indices, commodities, and currencies. They are also efficient across a range of timeframes from intraday to long-term analyses and can accommodate multiple trading strategies.
Predictive Power
Trendlines based on highlighting previous price actions help traders anticipate future price movements. This predictive ability helps traders identify potential entry and exit points. It also helps in making more informed decisions.
Dynamic Nature
In comparison with static support and resistance levels, trendlines adjust to market conditions and are a more versatile and reliable tool for analyzing the market. This adaptability is particularly useful in volatile markets.
Limitations of Trading with Trendlines and How to Overcome Them
Trendlines are very helpful for technical analysis, but they have their limits. These problems need to be identified and managed if traders want to enhance their trading with trendlines. The following are the most common limitations and practical ways to overcome them.
Subjectivity
Trendlines are always subjective. Traders can draw them in a different way depending on how they interpret price points. That can cause inconsistent outcomes. Avoid subjectivity by linking meaningful highs or lows and aligning with widely accepted patterns. Even more precision can be achieved by automated trendline plotting software.
False Breakouts
False breakouts are those when the price temporarily breaches the trendline and does not hold. To minimize risks, traders should check for breakouts when there is more trading volume. They should also verify using other indicators, like RSI, MACD, etc.
Conclusion
Trading with trendlines is a tried and tested strategy that remains vital in India’s trading ecosystem. Trendlines are not just lines on a chart but very useful analyses that allow traders to detect trends, predict movements, and make better decisions. Traders can increase profitability by knowing their types, drawing them correctly, and using them for breakout trading.
The usefulness of Trendlines is that they are applicable across market instruments, from equities and indices to commodities and currencies. Trendlines provide clarity and accuracy to Indian traders who have to grapple with markets that shift according to local and global factors. They help you spot gaps in the market during a rally, correction, or consolidation.
There’s no single formula to be a successful trader with trendlines, and it involves constant practice and refinement. Traders need to experiment with trendline charting on multiple time frames and instruments and try bullish, bearish, and sideways charts. If trendlines are paired with volume analysis and other related indicators, then they’re even more reliable.
Frequent Ask Questions
1. Is Trendline Trading Profitable?
Yes, you can make a lot of money by trading with trendlines if you use them correctly. Trendlines aid traders in determining trends, support, and resistance levels to make the price movements more probable. When traders apply trendline along with other technical analyses, such as volume or RSI, they can get a higher accuracy and lower risk. However, profitability is a matter of execution, practice, and understanding the market conditions.
2. What Is the Trendline Rule?
The trendline rule states that the trendline should link at least two significant price levels (either highs or lows) on a chart. A third point touching the trendline proves it even more solid. In order to perform a valid analysis, the trendline must be aligned closely to the market trend without creating relations with irrelevant price data.
3. Which Time Frame Is Best for a Trendline?
Intraday traders could use 5-minute or 15-minute time frames, and swing traders or positional traders might use daily or weekly charts. Combining multiple time frames gives an accurate picture of market movements and entry points for Indian traders.


