Elearnmarkets - Financial Market Learning
  • Categories
    • Basic Finance
    • Derivatives
      • Futures
      • Options
    • Financial Planning
    • Fundamental Analysis
    • Technical Analysis
    • Marketshala
    • Miscellaneous
  • Language
    • English
    • Hindi
    • Bengali
No Result
View All Result
  • Courses
  • Webinars
  • Stories
Elearnmarkets - Learn Stock Market, trading, investing for Free
No Result
View All Result
Home Technical Analysis
How to apply Hidden RSI Divergence for Swing Trading? 1

How to apply Hidden RSI Divergence for Swing Trading?

Elearnmarkets by Elearnmarkets
March 11, 2022
in Technical Analysis, Charts, Patterns & Indicators
Reading Time: 9 mins read
0
49.5k
VIEWS
Share on FacebookShare on XShare on WhatsApp
  • Hidden RSI Divergence is extremely strong predictor of a trend continuation or trend change.
  • There are crazy amount of divergences happening at all the time frames. Find one, wait for the price to test it, look for the re entry price you want, confirm with other tools in your technical tool box and then trade.
  • Bullish hidden rsi Divergence only happen in uptrend and the trend should continue to the upside. Whereas Bearish hidden rsi Divergance only happen in downtrend and the trend should continue to the downside.
  • For swing trading, do not have to carry the positions for a longer period of time. Typically a swing trade should be between 15 to 20 percent and then you can book your profit.
  • Don’t risk more than 1% of your capital till you master this strategy.
Table of Contents
What is Swing Trading?
What is Divergence?
What Does Divergence tell You?
Positive and Negative Divergence in RSI
Types of Divergences Patterns
What are Hidden Divergences?
Difference between Regular and Hidden Divergence
Swing Trading Using RSI Hidden Divergences
Common Mistakes made by the trader while trading with divergences

What is Swing Trading?

“The trend is your friend” is one of the best-known sayings.

Swing Trading basically means riding in the trends in the markets.

In swing trading, we try to identify the trend as it starts and try to jump on it before everyone else.

In swing trading, the most important thing is to identify the start and exit of the trend accurately. The more you read and learn about swing trading in technical Analysis, the more profitable and efficient your swing trades will be.

Once you have identified the trend, you can enter into a long or short trade and continue the trade as long as it starts.

In swing trading the quality of trades is more important than the quantity of trades. With 2-4 good swings in a month, one can easily have Return of Investment (ROI) above 100%.

What is Divergence?

In this swing trading strategy, we will use it in order to make the entry and exit decisions.

RelatedPosts

5 Tools to Spot Trend Reversals in Stocks 2

5 Tools to Spot Trend Reversals in Stocks

September 28, 2023
6k
Beginner's Guide to Trading Penny Stocks 3

Beginner’s Guide to Trading Penny Stocks

September 26, 2023
569
5 Important Volatility Indicators that Traders should know 4

5 Important Volatility Indicators that Traders should know

September 19, 2023
58.3k

It mainly develops when the indicator is moving in the opposite direction to the price.

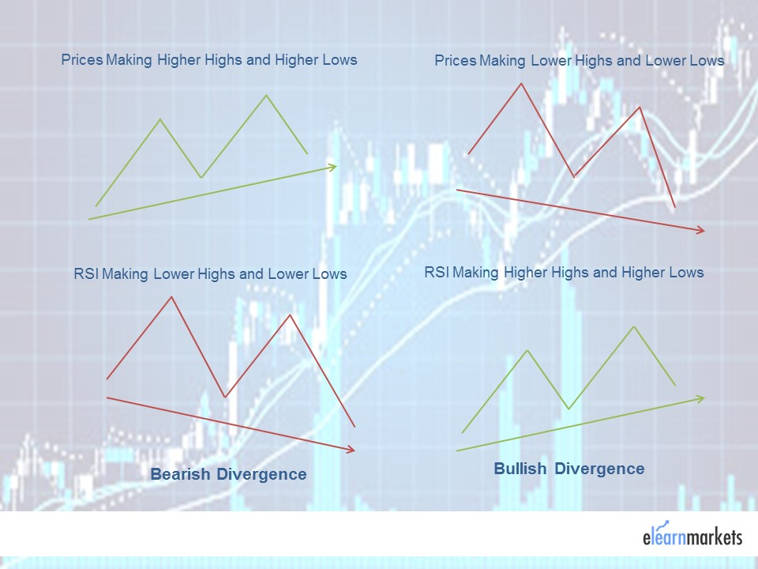
So if the prices are making a higher high and the indicator is making lower highs then it is an indication of bearish divergence in RSI.

In the same manner when the prices are making lower low and the indicator is making higher lows, then it is an indication of bullish divergence in RSI.

The most popular indicators for finding divergences are :

  • Stochastics
  • Moving Average Convergence and Divergence
  • Relative Strength Index (RSI)
  • Commodity Channel Index
  • William % R

What Does Divergence tell You?

It mainly signals negative and positive movement of prices along with any reversal if it is going to take place or not.

As discussed above, positive divergence takes place when the prices make a new low, whereas the indicator makes a high.

Similarly negative divergence takes place when the prices make a new high, but indicator makes a low.

Traders analyze the price movement of an asset and price reversal takes place or not.

Positive and Negative Divergence in RSI :

One can take the use of the Relative Strength Index (RSI) in order to spot positive and negative divergence in the price.

For example, after plotting RSI on the price chart, if the price of the stock is rising and making a high, whereas RSI is making a lower low, then one can consider it as a negative RSI.

Similarly, if the price of the stock is declining and making lower lows, whereas RSI is making higher high, then one can consider it as a positive RSI.

Learn from Market Experts

  • Divergences – Truths & Myths
  • Quantifying Divergence: Which divergence works and why?
  • Finding the Right Swing Trading Strategy

Types of Divergences Patterns:

Regular or Normal Divergences can be:

  • Bullish
  • Bearish
hidden rsi divergence

Irregular or Hidden Divergences can be:

  • Bullish
  • Bearish

What are Hidden Divergences?

We can understand it by understanding the difference between the regular and hidden divergence.

Regular divergence is a trend reversal signal whereas hidden divergence is a trend continuation signal.

Points to remember:

Hidden Bullish Divergence

  • During an uptrend.
  • Once price makes a higher Low, but oscillator makes a lower Low.
  • The trend should continue to the upside.

Hidden Bearish Divergence

  • During a downtrend.
  • Once price makes a lower high, but oscillator makes higher high
  • The trend should continue to the downside.

Difference between Regular and Hidden Divergence:

Hidden divergence mainly signals the continuation of the trend whereas regular divergence signals trend reversals.

Suppose the trend of the stock is upward, but the prices have started falling whereas the RSI is making a higher high, then a trader can spot this as a positive hidden divergence, and may increase his quantity by buying on the dip.

Now, the prices are increasing, but suddenly RSI starts making a lower low, then the trader should become cautious as a bearish regular divergence is being made, and there could be price reversal.

 Swing Trading Using Hidden RSI Divergences:

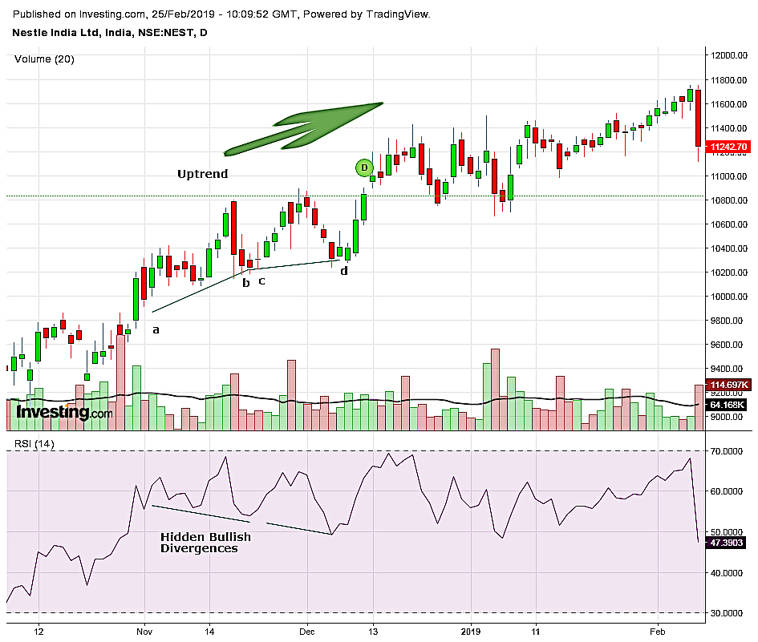
Let us understand this concept of swing trading by the example demonstrated below using Bullish Hidden RSi Divergence:

One should note that in this strategy we are buying in temporary weakness in an ongoing strong uptrend.

From the daily chart of Nestle below, we can see that there is a strong uptrend. From the point a-b, the prices have continued making higher lows and the RSI have made a lower low. Here we can spot bullish hidden rsi divergence. At point B we can buy this stock by confirming its volume.

From the point c-d again the prices made higher lows but the Relative Strength Index made lower lows. Again we can spot here a bullish hidden divergence. We can see that at point d, there is buying pressure by confirming with the volume and we can buy more. By this, we can get confirmation that the uptrend is going to continue.

BUT BE CAUTIOUS!

If prices are moving up, isn’t that supposed to mean Bullish?

Shouldn’t the momentum confirm that there is strength to the upside?  We can see that momentum clearly does not match the movement of price.

But one should also notice that weakness is also setting in this trend as the RSI keeps making lower lows. While trading with the trend one should remain cautious when the trend is going to reverse as there is weakness in the momentum. Once RSI consistently forms lower lows, the price will also start forming lower lows.

One needs to remember when you are swing trading simply swing trade. You do not have to carry these positions for a longer period of time. Typically a swing trade should be between 15 to 20 percent and then you can book your profit.

nestle chart

From the chart above We can conclude that:

  • Trend: There is a clear structure of price trending, higher highs and higher lows.
  • Time Frame: Daily chart for swing trades.
  • Sign: RSI Hidden Bullish Divergence is just a sign for taking a long position.
  • Trigger: Start buying at the dips till previous low holds. This serves better Risk-Reward ratio.
  • Stop Loss: Most recent low on the price.
  • Risk: Don’t risk more than 1% till you master this strategy.

Common Mistakes made by the trader while trading with divergences:

A common mistake that many novice traders make while trading is the minute they notice the hidden rsi divergence, they take the trade accordingly.

As new traders as well the experienced traders, we need to confirm that the hidden rsi divergence is real and wait for future price action.

In order to get the latest updates about Financial Markets visit StockEdge

Happy Learning!

Tags: bullish divergenceenglishintermediateswing trading
ShareTweetSend
Get Kotak Offer Get Kotak Offer Get Kotak Offer
Previous Post

Assessing management quality stock before investing

Next Post

Chinese Counterparts inability a boon for Specialty Chemical Sector

Elearnmarkets

Elearnmarkets

Elearnmarkets (ELM) is a complete financial market portal where the market experts have taken the onus to spread financial education. ELM constantly experiments with new education methodologies and technologies to make financial education effective, affordable and accessible to all. You can connect with us on Twitter @elearnmarkets.

Related Posts

5 Tools to Spot Trend Reversals in Stocks 5
Technical Analysis

5 Tools to Spot Trend Reversals in Stocks

September 28, 2023
6k
Beginner's Guide to Trading Penny Stocks 6
Technical Analysis

Beginner’s Guide to Trading Penny Stocks

September 26, 2023
569
5 Important Volatility Indicators that Traders should know 7
Technical Analysis

5 Important Volatility Indicators that Traders should know

September 19, 2023
58.3k
Top 5 Momentum Indicators that Analyses Trend Strength 8
Technical Analysis

Top 5 Momentum Indicators that Analyses Trend Strength

September 7, 2023
94.1k

Leave a Reply Cancel reply

Your email address will not be published. Required fields are marked *

Elearnmarkets Logo

Follow Us

Facebook-f Twitter Instagram Linkedin-in Youtube Telegram

Register on Elearnmarkets

Continue your financial learning by creating your own account on Elearnmarkets.com

Register Free Account

Download App

Playstore logo
Download on app store

Categories

  • Basic Finance
  • Derivatives
  • Financial Planning
  • Fundamental Analysis
  • Technical Analysis
  • Marketshala
  • Miscellaneous

Popular On Elearnmarkets

  • Market Superheroes:
  • Vivek Bajaj
  • Chetan Panchamia
  • Ashish Kyal
  • Premal Parekh
  • Abhijit Paul
  • Jegan
  • Sivakumar Jayachadran
  • Vishal Malkan
  • Jyoti Budhia
  • Vivek Gadodia
  • Vishal Mehta
  • Piyush Chaudhry
  • Santosh Pasi
  • Gomathi Shankar
  • Market Superheroes:
  • Vivek Bajaj
  • Chetan Panchamia
  • Ashish Kyal
  • Premal Parekh
  • Abhijit Paul
  • Jegan
  • Sivakumar Jayachadran
  • Vishal Malkan
  • Jyoti Budhia
  • Vivek Gadodia
  • Vishal Mehta
  • Piyush Chaudhry
  • Santosh Pasi
  • Gomathi Shankar
  • Courses:​
  • Options Trading
  • Dow Theory
  • Momentum Trading
  • Stock Investing
  • Stock Market for Beginners
  • Harmonic Chart Patterns
  • Algo Trading
  • Elliot Wave Theory
  • Advanced Excel
  • Cryptocurrency
  • NSE Certification Course
  • Courses:​
  • Options Trading
  • Dow Theory
  • Momentum Trading
  • Stock Investing
  • Stock Market for Beginners
  • Harmonic Chart Patterns
  • Algo Trading
  • Elliot Wave Theory
  • Advanced Excel
  • Cryptocurrency
  • NSE Certification Course
  • Webinars:
  • Bank Nifty Scalping
  • Intraday Trading Strategies
  • Options Trading Strategies
  • Options selling
  • Price Action
  • Relative Strength
  • Tax Planning
  • Options Buying
  • Growth Stocks
  • Portfolio Management
  • Relative Strength Index
  • Risk Management
  • Renko Charts
  • Crude Oil
  • Traders Psychology
  • Moving Average
  • Multibagger Stocks
  • Free Learning Modules:
  • Intraday Trading
  • Options Scalping
  • Swing Trading
  • Financial Modelling
  • RSI Indicator
  • Bollinger Bands
  • Pricing of Futures
  • Personal Finance
  • Initial Public Offerings (IPO)
  • Value Investing
  • Technical Indicators
  • Candlesticks
  • Chart Patterns
  • Option Greeks
  • ELSS Funds
  • Banking and Insurance
  • Real Estate
  • Gold
  • Book Summaries:
  • Rich Dad Poor Dad
  • Psychology of Money
  • The Intelligent Investor
  • The Richest Man in Babylon
  • Think and Trade Like a Champion
  • Value Investing and Behavioural Finance
  • Trading in the Zone
  • Learn to Earn
  • Book Summaries:
  • Rich Dad Poor Dad
  • Psychology of Money
  • The Intelligent Investor
  • The Richest Man in Babylon
  • Think and Trade Like a Champion
  • Value Investing and Behavioural Finance
  • Trading in the Zone
  • Learn to Earn
  • Tools:
  • CAGR Calculator
  • SIP Calculator
  • eLearnOptions
  • Future Value Calculator
  • Present Value Calculator
  • Atal Pension Yojana
  • Cost of Delay Calculator
  • Become a Crorepati
  • Tools:
  • CAGR Calculator
  • SIP Calculator
  • eLearnOptions
  • Future Value Calculator
  • Present Value Calculator
  • Atal Pension Yojana
  • Cost of Delay Calculator
  • Become a Crorepati

© 2023 Elearnmarkets. All Rights Reserved

  • Visit Elearnmarkets
  • Courses
  • Webinars
  • Financial Guides
  • Get Free Counselling
  • Visit Elearnmarkets
  • Courses
  • Webinars
  • Financial Guides
  • Get Free Counselling

Get Elearnmarkets App

No Result
View All Result
  • Article Categories
    • Basic Finance
    • Derivatives
    • Financial Planning
    • Fundamental Analysis
    • Technical Analysis
    • Marketshala
    • Miscellaneous
  • Language
    • Hindi
    • Bengali
    • English
  • Courses
  • Webinars
  • Stories

© 2020 Elearnmarkets All Rights Reserved

A Handbook of Technical Analysis
To start your trading journey as a seasoned technical analyst
Download Now
View Details
View Course Details
Guidebook On Chart Patterns
Take Your Trading To The Next Level With Strategies Shared In This Ebook
Download Now