- Hidden RSI Divergence is extremely strong predictor of a trend continuation or trend change.
- There are crazy amount of divergences happening at all the time frames. Find one, wait for the price to test it, look for the re entry price you want, confirm with other tools in your technical tool box and then trade.
- Bullish hidden rsi Divergence only happen in uptrend and the trend should continue to the upside. Whereas Bearish hidden rsi Divergance only happen in downtrend and the trend should continue to the downside.
- For swing trading, do not have to carry the positions for a longer period of time. Typically a swing trade should be between 15 to 20 percent and then you can book your profit.
- Don’t risk more than 1% of your capital till you master this strategy.
What is Swing Trading?
“The trend is your friend” is one of the best-known sayings.
Swing Trading basically means riding in the trends in the markets.
In swing trading, we try to identify the trend as it starts and try to jump on it before everyone else.
In swing trading, the most important thing is to identify the start and exit of the trend accurately. The more you read and learn about swing trading in technical Analysis, the more profitable and efficient your swing trades will be.
Once you have identified the trend, you can enter into a long or short trade and continue the trade as long as it starts.
In swing trading the quality of trades is more important than the quantity of trades. With 2-4 good swings in a month, one can easily have Return of Investment (ROI) above 100%.
What is Divergence?
In this swing trading strategy, we will use it in order to make the entry and exit decisions.
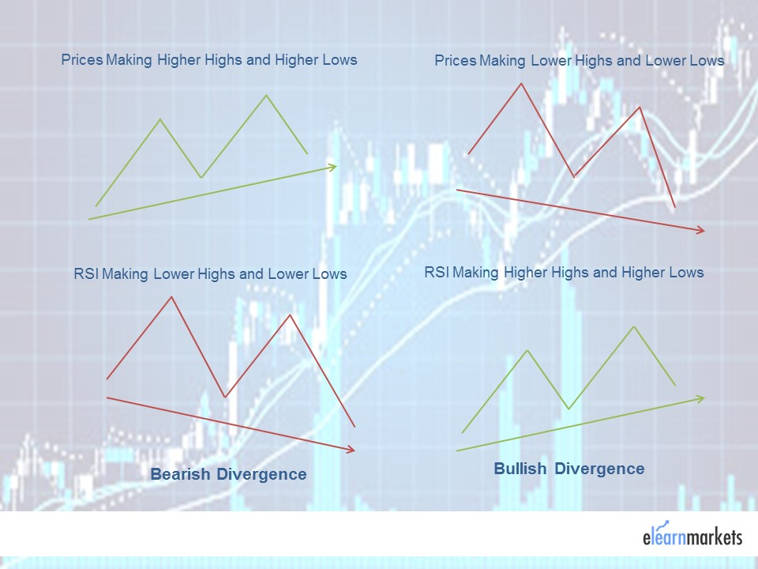
It mainly develops when the indicator is moving in the opposite direction to the price.
So if the prices are making a higher high and the indicator is making lower highs then it is an indication of bearish divergence in RSI.
In the same manner when the prices are making lower low and the indicator is making higher lows, then it is an indication of bullish divergence in RSI.
The most popular indicators for finding divergences are :
- Stochastics
- Moving Average Convergence and Divergence
- Relative Strength Index (RSI)
- Commodity Channel Index
- William % R
What Does Divergence tell You?
It mainly signals negative and positive movement of prices along with any reversal if it is going to take place or not.
As discussed above, positive divergence takes place when the prices make a new low, whereas the indicator makes a high.
Similarly negative divergence takes place when the prices make a new high, but indicator makes a low.
Traders analyze the price movement of an asset and price reversal takes place or not.
Positive and Negative Divergence in RSI :
One can take the use of the Relative Strength Index (RSI) in order to spot positive and negative divergence in the price.
For example, after plotting RSI on the price chart, if the price of the stock is rising and making a high, whereas RSI is making a lower low, then one can consider it as a negative RSI.
Similarly, if the price of the stock is declining and making lower lows, whereas RSI is making higher high, then one can consider it as a positive RSI.
Learn from Market Experts
Types of Divergences Patterns:
Regular or Normal Divergences can be:
- Bullish
- Bearish

Irregular or Hidden Divergences can be:
- Bullish
- Bearish
What are Hidden Divergences?
We can understand it by understanding the difference between the regular and hidden divergence.
Regular divergence is a trend reversal signal whereas hidden divergence is a trend continuation signal.
Points to remember:
Hidden Bullish Divergence
- During an uptrend.
- Once price makes a higher Low, but oscillator makes a lower Low.
- The trend should continue to the upside.
Hidden Bearish Divergence
- During a downtrend.
- Once price makes a lower high, but oscillator makes higher high
- The trend should continue to the downside.
Difference between Regular and Hidden Divergence:
Hidden divergence mainly signals the continuation of the trend whereas regular divergence signals trend reversals.
Suppose the trend of the stock is upward, but the prices have started falling whereas the RSI is making a higher high, then a trader can spot this as a positive hidden divergence, and may increase his quantity by buying on the dip.
Now, the prices are increasing, but suddenly RSI starts making a lower low, then the trader should become cautious as a bearish regular divergence is being made, and there could be price reversal.
Swing Trading Using Hidden RSI Divergences:
Let us understand this concept of swing trading by the example demonstrated below using Bullish Hidden RSi Divergence:
One should note that in this strategy we are buying in temporary weakness in an ongoing strong uptrend.
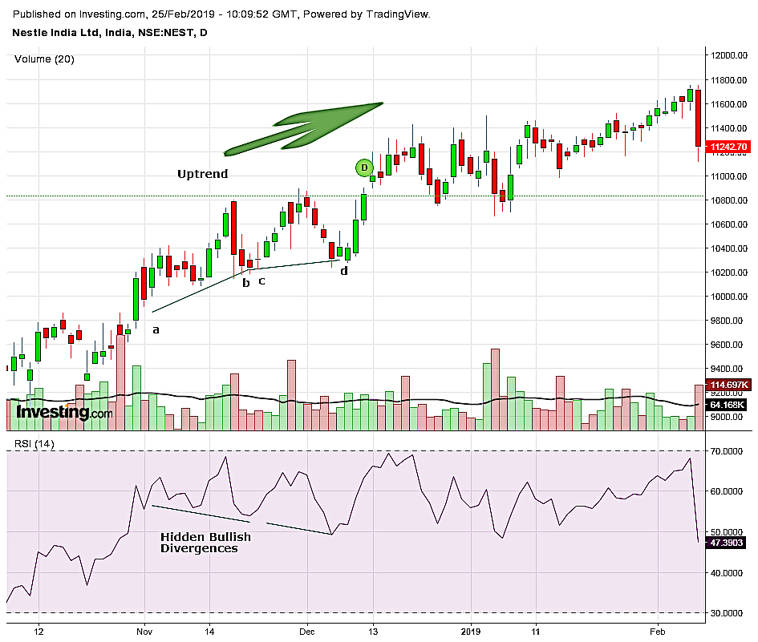
From the daily chart of Nestle below, we can see that there is a strong uptrend. From the point a-b, the prices have continued making higher lows and the RSI have made a lower low. Here we can spot bullish hidden rsi divergence. At point B we can buy this stock by confirming its volume.
From the point c-d again the prices made higher lows but the Relative Strength Index made lower lows. Again we can spot here a bullish hidden divergence. We can see that at point d, there is buying pressure by confirming with the volume and we can buy more. By this, we can get confirmation that the uptrend is going to continue.
BUT BE CAUTIOUS!
If prices are moving up, isn’t that supposed to mean Bullish?
Shouldn’t the momentum confirm that there is strength to the upside? We can see that momentum clearly does not match the movement of price.
But one should also notice that weakness is also setting in this trend as the RSI keeps making lower lows. While trading with the trend one should remain cautious when the trend is going to reverse as there is weakness in the momentum. Once RSI consistently forms lower lows, the price will also start forming lower lows.
One needs to remember when you are swing trading simply swing trade. You do not have to carry these positions for a longer period of time. Typically a swing trade should be between 15 to 20 percent and then you can book your profit.

From the chart above We can conclude that:
- Trend: There is a clear structure of price trending, higher highs and higher lows.
- Time Frame: Daily chart for swing trades.
- Sign: RSI Hidden Bullish Divergence is just a sign for taking a long position.
- Trigger: Start buying at the dips till previous low holds. This serves better Risk-Reward ratio.
- Stop Loss: Most recent low on the price.
- Risk: Don’t risk more than 1% till you master this strategy.
Common Mistakes made by the trader while trading with divergences:
A common mistake that many novice traders make while trading is the minute they notice the hidden rsi divergence, they take the trade accordingly.
As new traders as well the experienced traders, we need to confirm that the hidden rsi divergence is real and wait for future price action.
In order to get the latest updates about Financial Markets visit StockEdge
Happy Learning!


