Key Takeaways:
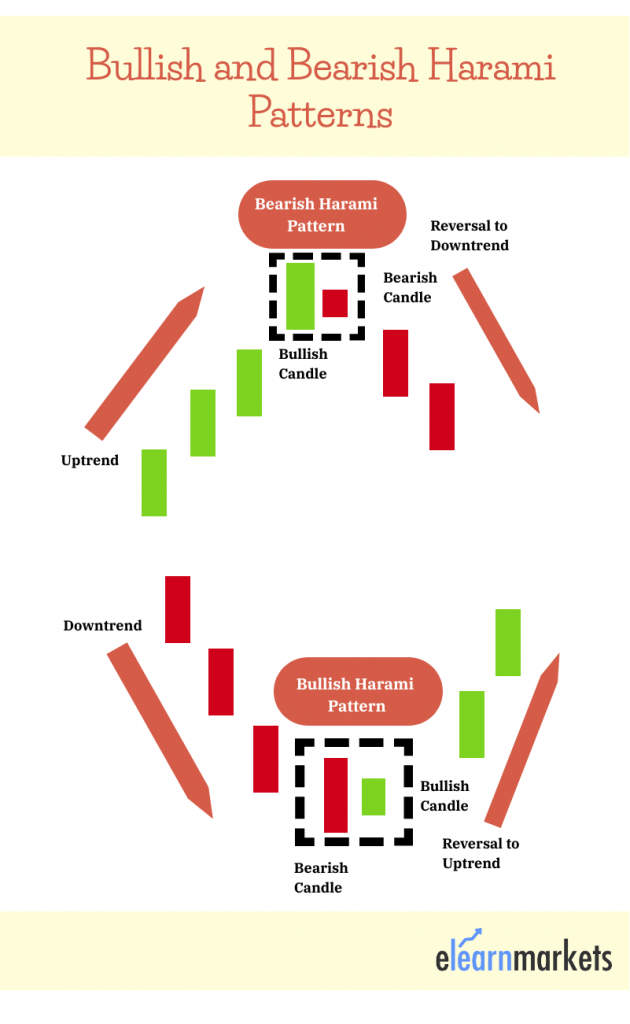
- Bullish Harami pattern forms during a downtrend with a large bearish candle followed by a small bullish candle inside its body.
- It indicates potential reversal from bearish to bullish sentiment.
- Bearish Harami pattern appears during an uptrend with a large bullish candle followed by a small bearish candle inside its body.
- It signals a possible shift from bullish to bearish sentiment.
- Traders use these patterns as early warning signs of trend reversal, confirmed by the next candle.
The Harami, which means “pregnant” in Japanese, is a multiple candlestick pattern and is considered a reversal pattern.
The first candlestick is referred to as the “mother” with a large real body that embodies the smaller second candlestick, thus creating the visual of a pregnant mother.
The Harami candlestick pattern is the opposite of the engulfing pattern, except that the candlesticks in the harami candlestick pattern can be the same colour.
Like the engulfing pattern, this pattern also consists of two candlesticks but with the first candlestick being a large candlestick and the second being a smaller candlestick.
What is Bullish Harami Pattern?
A Bullish Harami candlestick is formed when a large bearish red candle appears on Day 1 that is followed by a smaller bearish candle on the next day.
One should note that the important aspect of the bullish Harami is that prices should gap up on Day 2.
The price is held up by the buyers and is unable to fall to the bearish close of Day 1.
What is Bearish Harami Pattern?
A Bearish Harami candlestick is formed when there is a large bullish candle on Day 1 and is followed by a smaller bearish candle on Day 2.
One should note that the important aspect of the bearish Harami candlestick is that prices gapped down on Day 2, and also, they were unable to move higher back to the close of Day 1.
This signals that there is uncertainty in the continuation of the ongoing trend.
Formation
Here is the formation of the Bullish and Bearish Harami candlestick Patterns:
Harami Cross:
The Harami cross characterized by a very small real body almost like a Doji, the smaller the real body, the better it is for this formation.
Due to the lack of a real body after a strong move tells that the previous trend is coming to an end and a reversal may take place.
The high or low of a Harami cross setup provides resistance or support for any further price moves.
Trading Strategies:
Now let us discuss how you can trade with Bullish and Bearish Harami candlestick:

1. Trading Harami with Price Action:
As the harami candle itself a price action component one should always include the price action strategy option in our analysis.
When we trade with price action, it means to rely fully on the price action on the chart.
This means without any indicators, oscillators or moving averages, etc.
One should rely on the chart patterns, candle patterns, support and resistance, and so on.
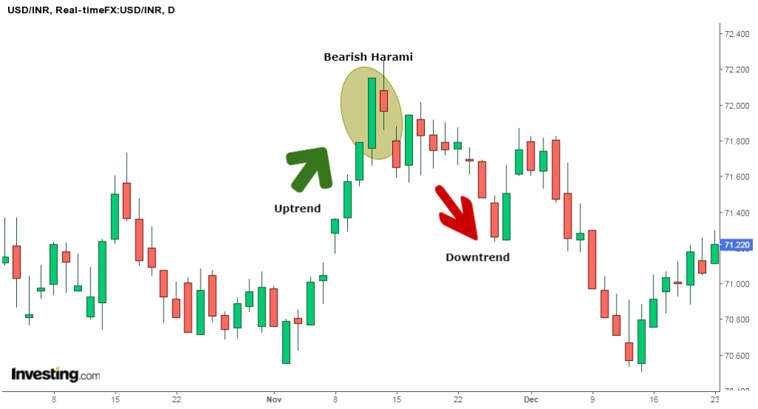
Here is an example of trading Bearish Harami using price action. In the daily chart of USD/INR, we can see a Bearish Harami formed at the end of the uptrend.
This Bearish Harami should be confirmed with resistance or any other chart or candlestick pattern.
We can see in the chart how after the pattern formation, the prices have gapped down confirming the reversal signaled by this pattern.
2. Trading Harami with Indicators
In this trading strategy, we will combine the harami with Bollinger bands.
One should only trade the haramis, which form when the price touches a level of the upper or lower Bollinger bands.
For example, once the price touches the upper Bollinger band at the same time a harami is formed, you can enter a short position as shown below.
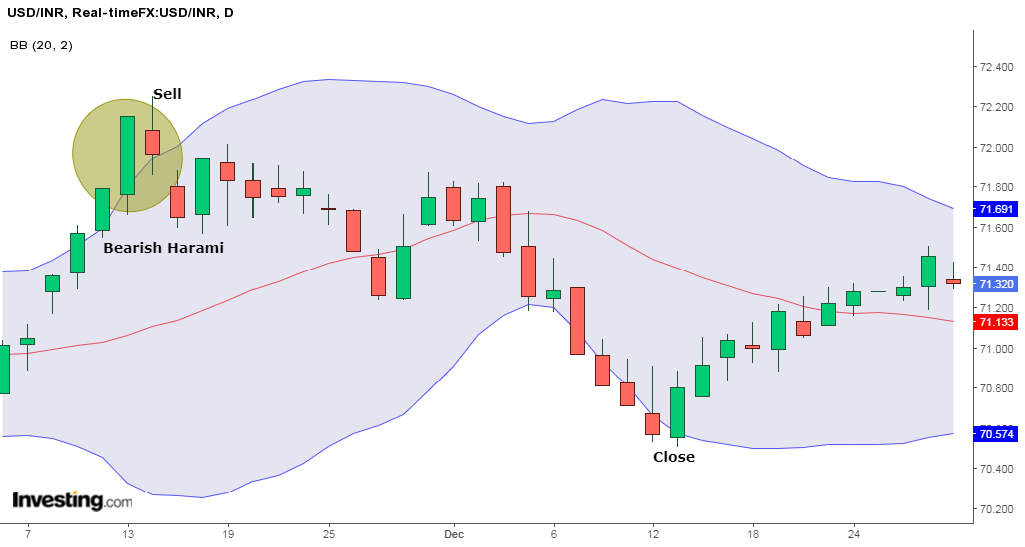
One should hold their position and close it until the price touches the lower Bollinger band.
Read More- All 35 Candlestick Chart Patterns in the Stock Market
How to use Bullish and Bearish Harami Candlestick Scans in StockEdge
You can also use the Bullish and Bearish Harami Candlestick scans in StockEdge web version:
Steps to use Bullish and Bearish Harami in StockEdge:
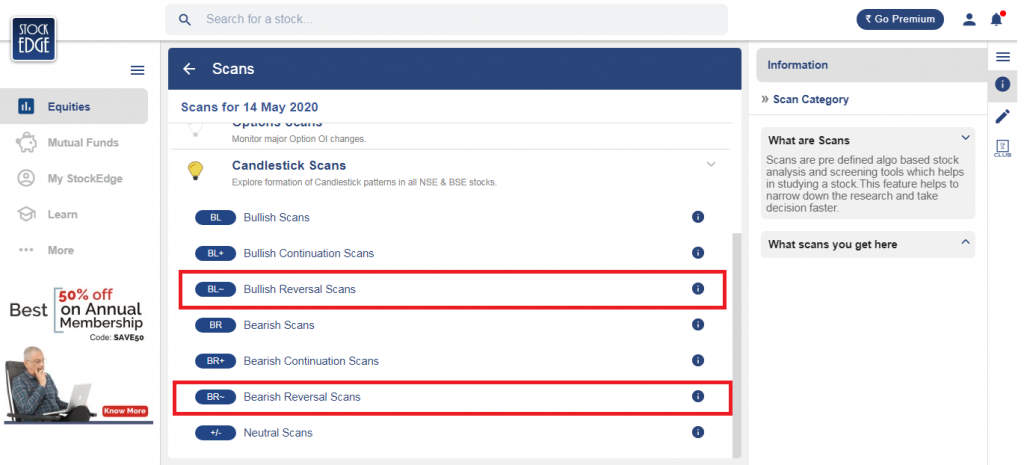
- Under the “Candlestick Scans” we can see Bullish and Bearish Reversal Scans as shown below:
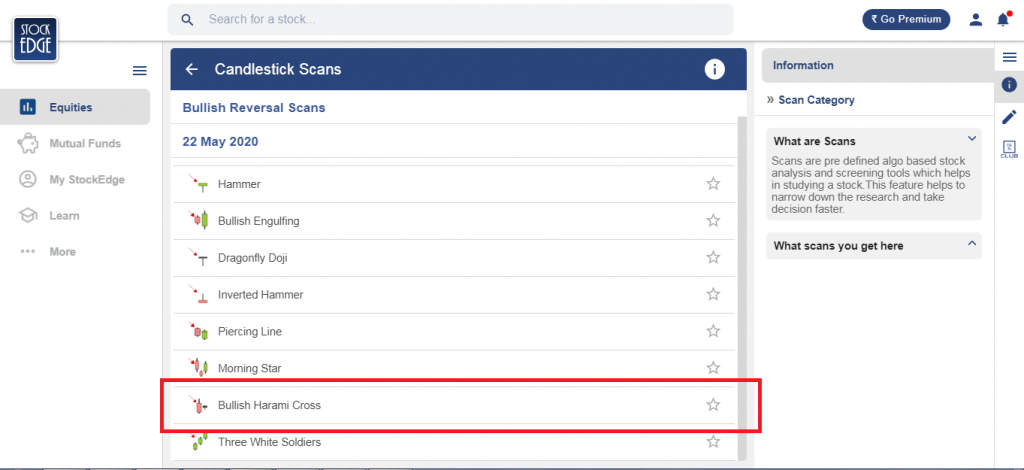
- When we click on the “Bullish Reversal Scans” we can see “Bullish Harami” scan, click on that:
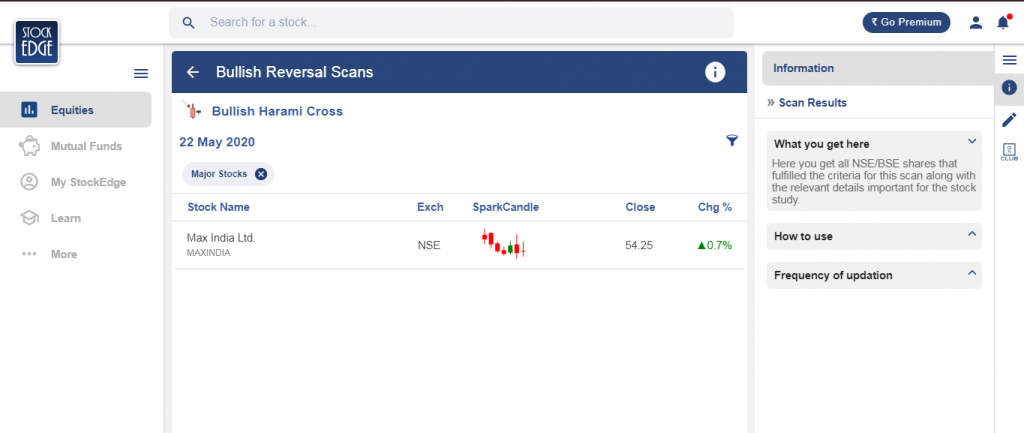
- After selecting on it, you will get a list of stocks in which “Bullish Harami” pattern is formed as shown below:
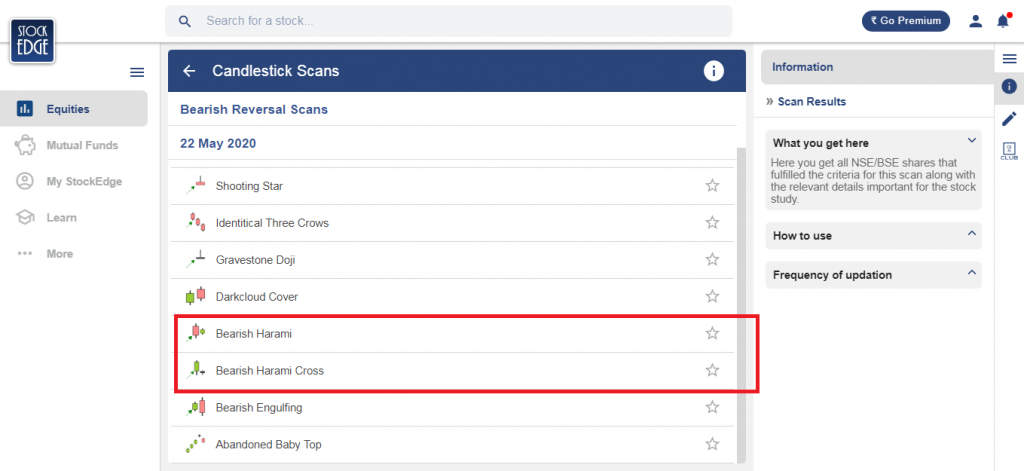
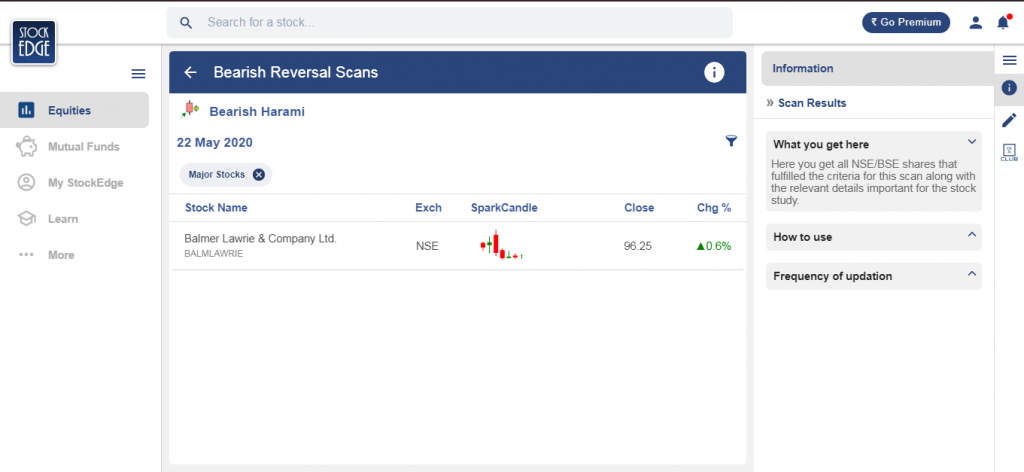
- Similarly, when we click on the “Bearish Reversal Scans” we can see “Bearish Harami” scan, click on that:
- After selecting on it, you will get a list of stocks in which “Bearish Harami” pattern is formed as shown below:
Bottomline
The Harami, which means “pregnant” in Japanese, is a multiple candlestick pattern that is considered a reversal pattern. This pattern consists of two candlesticks, with the first candlestick being a large candlestick and the second being a smaller candlestick. The Harami cross characterized by a very small real body almost like a Doji, the smaller the real body, the better it is for this formation. As the harami candle itself a price action component one should always include the price action strategy option in our analysis. One should only trade the haramis, which form when the price touches a level of the upper or lower Bollinger bands.
Frequently Asked Questions (FAQs)
What does a Harami Candle Indicate?
An archaic Japanese term that means “pregnant” is the source of the word “harami.” A smaller body on the next doji must close higher within the body of the previous day’s candle in order for a bullish harami to form, indicating a larger chance of a reversal.
Which is More Bearish Harami or Doji?
A big down candle followed by a doji indicates a bullish harami cross. It happens when things are falling. A rise higher in price that conforms to the pattern validates the bullish harami cross. A huge rising candle followed by a doji indicates a bearish harami cross.
How Accurate is the Harami Candlestick Pattern
The bullish harami candlestick exhibits nearly random behavior, with reversals having a 53% to 47% advantage over continuations. This implies that you will probably be unable to accurately predict the breakout direction.


Thank you so much @ admin for share your valuable thoughts and ideas We always enjoy your articles its inspired a lot by reading your articles day by day. So please accept my thanks and congrats for success of your latest series. We hope, you should published more better articles like ever before
Hi,
Thank you for reading our blog!
You can read more blogs on technical analysis here.
Keep Reading!
Kindly explain how Harami Cross works?
Hi,
The Harami cross works just the same as the Harami pattern as explained in the blog.
The only difference is the formation of the Harami Cross. The first candlestick is the long bodied candlestick and the second candlestick is a Doji.
Thank you for Reading!