Key Takeaways
- Hanging Man is a bearish reversal pattern that forms at the top of an uptrend, signalling possible trend exhaustion.
- It has the same structure as a Hammer, but the context differs—Hanging Man appears in uptrends, Hammer in downtrends.
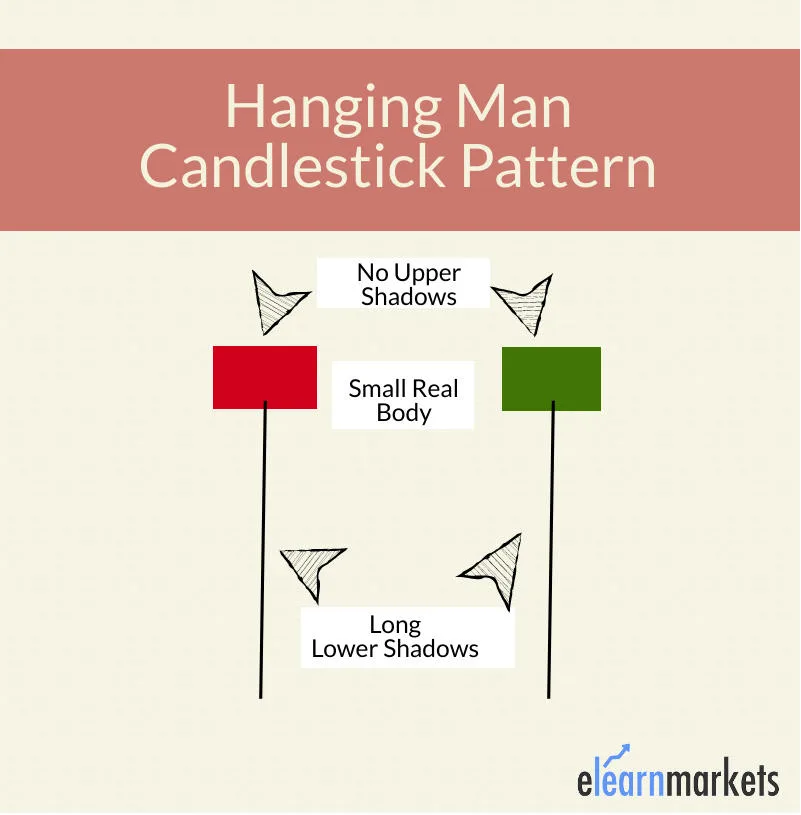
- The candle has a small body near the top with a long lower shadow, usually at least twice the body length.
- The pattern on its own is weak, so bearish confirmation on the next candle is important before trading.
- When confirmed, the pattern shows around 60–65% reliability, but accuracy drops without confirmation.
- Higher volume during the Hanging Man and the confirmation candle increases the strength of the signal.
- Key Takeaways
- What is the Hanging Man Candlestick Pattern?
- Critical Understanding: Context Determines Meaning
- Formation and Psychology of Hanging Man Candlestick Pattern
- Identification Criteria of Hanging Man Candlestick Pattern
- The Critical Importance of Confirmation
- Trading Strategies of the Hanging Man Candlestick Pattern
- Common Mistakes and How to Avoid Them
- Hanging Man Candlestick Pattern vs. Similar Patterns
- Final Reminder
- Frequently Asked Questions (FAQs)
What is the Hanging Man Candlestick Pattern?
The Hanging Man Candlestick Pattern is a single-candle bearish reversal pattern that appears at the end of an uptrend. Despite its ominous name (derived from its resemblance to a hanging person with legs dangling), it’s a relatively weak reversal signal that requires confirmation.
Why It’s Called “Hanging Man”
The pattern resembles a person hanging with their legs dangling below. In Japanese candlestick terminology, this visual serves as a warning, just as a hanging man is an ominous sight; this pattern warns of potential market trouble ahead.
Critical Understanding: Context Determines Meaning
Most Important Concept: The Hanging Man Candlestick pattern is IDENTICAL in structure to the Hammer Candlestick pattern. The only difference is context:
| Pattern | Context | Implication |
| Hanging Man Candlestick Pattern | Appears at top of uptrend | Bearish reversal signal |
| Hammer Candlestick Pattern | Appears at bottom of downtrend | Bullish reversal signal |
This is why identifying the prior trend is absolutely critical before interpreting the pattern.
Formation and Psychology of Hanging Man Candlestick Pattern
What Happens During Formation
During the Trading Session:
- Opening: Market opens (body location)
- Intraday: Price drops significantly as sellers take control
- Recovery: Buyers push price back up
- Close: Price closes near the open, forming small body at top
The Psychology:
What the Long Lower Shadow Tells Us:
- Sellers tested lower prices during the session
- Bears attempted to take control
- Bulls fought back and recovered most losses
- Critical Question: Was the recovery genuine strength or just temporary?
Why It’s Potentially Bearish:
- The fact that sellers could push prices down significantly shows their presence
- Bulls managed to recover, but they’re showing fatigue (hence small body)
- This tug-of-war often precedes a bearish takeover
- The pattern suggests bulls are losing conviction
Identification Criteria of Hanging Man Candlestick Pattern
Strict Requirements
To qualify as a valid Hanging Man, ALL these conditions must be met:
1. Prior Trend Requirement
- MUST appear after an uptrend
- Uptrend should be clearly established (minimum 3-5 bullish candles or clear higher highs)
- Pattern loses significance in sideways or downtrending markets
2. Body Characteristics
- Small real body (difference between open and close)
- Body can be bullish (green) or bearish (red); color doesn’t matter much
- Body should be at the upper end of the total range (top 25% of the candle)
3. Shadow Requirements
- Lower shadow minimum: At least 2x the length of the real body
- Ideal lower shadow: 3x or more the body length
- Upper shadow: Should be very small or nonexistent
- Maximum upper shadow: No more than 10-15% of body length
4. Position Requirements
- Forms at or near recent highs
- Ideally at resistance levels
- After extended rally (not just minor pullback recovery)
Size Ratio Guidelines
| Lower Shadow to Body Ratio | Signal Strength | Notes |
| 2:1 | Weak | Minimum requirement, needs strong confirmation |
| 3:1 | Moderate | Standard pattern, still needs confirmation |
| 4:1+ | Strong | More significant, but confirmation still critical |
The Critical Importance of Confirmation
Major Flaw in Many Explanations: Treating the Hanging Man as an immediate sell signal.
The Reality: The Hanging Man is a WARNING signal, not a trading signal. You must wait for confirmation.
What Confirmation Looks Like
Strong Confirmation:
- Next candle is bearish (red/black)
- Next candle closes below the Hanging Man’s body
- Next candle has above-average volume
- Ideally, next candle closes in the lower 50% of Hanging Man’s range
Weak Confirmation:
- Next candle is bearish but volume is low
- Next candle closes below Hanging Man but only slightly
- Gap down followed by recovery
No Confirmation (Pattern Failed):
- Next candle is bullish
- Next candle closes above Hanging Man’s high
- Uptrend continues strongly
Statistical Reality
Without Confirmation:
- Success rate: 40-50% (essentially random)
- Not worth trading
With Strong Confirmation:
- Success rate: 60-65%
- Tradeable with proper risk management
With Multiple Confluence Factors:
- Success rate: 70-75%
- High-probability setup
Trading Strategies of the Hanging Man Candlestick Pattern
Strategy 1: Conservative Confirmation Entry
Setup:
- Identify valid Hanging Man in uptrend
- Wait for next candle (confirmation candle)
- Confirmation candle must be bearish and close below Hanging Man body
Entry:
- Enter short at the close of the confirmation candle
- OR enter on a break below the Hanging Man’s low (more aggressive)
Stop Loss:
- Place stop above the Hanging Man’s high
- Add 1-2% buffer for volatility
Target:
- First target: Recent support level
- Second target: Measure Hanging Man’s total range, project that distance downward
- Trailing stop: Use ATR-based trailing stop once 1R profit achieved
Example:
Hanging Man forms at $100 (high: $101, low: $95, close: $100)
Next day closes bearish at $98
Entry: $98 (at close) or $95 (break of low)
Stop: $101.50 (above high with buffer)
Target 1: $92 (previous support)
Target 2: $89 (range projection: $100 – $6 range = $94 low, projected down)
Strategy 2: Volume-Confirmed Entry
Setup:
- Hanging Man forms with volume at least 1.5x average
- Next candle is bearish with volume expansion (2x average or more)
Why Volume Matters:
| Volume Pattern | Interpretation | Reliability |
| High on Hanging Man, High on Confirmation | Strong selling pressure, reliable | 70-75% |
| Low on Hanging Man, High on Confirmation | Late sellers entering, moderate | 60-65% |
| High on Hanging Man, Low on Confirmation | Weak follow-through, questionable | 50-55% |
| Low on both | Lack of conviction, avoid | 40-50% |
Entry & Risk Management:
- Same as Strategy 1, but higher position size justified by volume confirmation
- Consider using tighter trailing stops due to higher conviction
Strategy 3: Resistance Confluence Entry
Setup:
- Hanging Man forms at major resistance level
- Resistance level has been tested multiple times previously
- Additional confluence: Fibonacci retracement, moving average, trendline
High-Probability Scenario:
- Hanging Man at 61.8% Fibonacci retracement
- Price also at 200-day moving average
- Overbought RSI (>70)
- Bearish divergence on MACD
Entry:
- Wait for confirmation candle
- Enter on close of confirmation candle
- Alternatively, enter on break below resistance level
Why This Works: Multiple factors confirming resistance creates high probability that uptrend is exhausted.
Strategy 4: Pattern Cluster Entry
Setup: When Hanging Man appears with other reversal signals:
- Hanging Man + Evening Star pattern
- Hanging Man + Bearish Engulfing on confirmation day
- Hanging Man + Dark Cloud Cover
Example Scenario: Day 1: Long bullish candle Day 2: Hanging Man Day 3: Bearish candle that engulfs Hanging Man (creates Evening Star + Hanging Man combo)
Trading: This creates extremely high-probability setup
- Enter at close of Day 3
- Stop above Day 1 high
- More aggressive targets justified (previous support -5% or more)
Common Mistakes and How to Avoid Them
Mistake 1: Trading Without Confirmation
The Problem: Seeing Hanging Man and immediately shorting or selling long positions.
Why It Fails:
- Pattern alone has ~50% success rate
- Many Hanging Men fail to reverse the trend
- Bulls often resume control after one-day pause
The Fix:
- Always wait for bearish confirmation candle
- Never trade the pattern in isolation
- Patience prevents majority of losing trades
Mistake 2: Ignoring the Prior Trend
The Problem: Identifying Hanging Man-like patterns in downtrends or sideways markets and treating them bearishly.
Why It Fails:
- Pattern requires established uptrend to have meaning
- Same structure in downtrend is a Hammer (bullish)
- Context determines interpretation
The Fix:
- Before identifying any Hanging Man, confirm uptrend exists
- Use multiple timeframe analysis
- Look for clear higher highs and higher lows
Mistake 3: Color Confusion
The Problem: Thinking the Hanging Man must be red (bearish) to be valid.
Why It’s Wrong:

- Hanging Man can be green or red
- A green (bullish) Hanging Man can be MORE bearish because:
- Bulls managed to close positive despite intraday selling
- But couldn’t push significantly higher
- Shows bulls are struggling despite positive close
The Fix:
- Don’t filter Hanging Men by color
- Focus on body size and shadow length
- Both colors are valid
Mistake 4: Weak Upper Shadow Ignorance
The Problem: Accepting patterns with long upper shadows as valid Hanging Men.
Why It Matters:
- Long upper shadow shows bears tried to push down AND bulls pushed up significantly
- This is more like indecision (Spinning Top) than bearish warning
- Pattern loses its meaning
The Fix:
- Upper shadow should be minimal (10-15% of body max)
- If upper shadow is substantial, pattern is not a valid Hanging Man
- Look for body at the very top of the range
Mistake 5: Position Sizing Errors
The Problem: Using same position size for all Hanging Man trades regardless of confluence.
Why It’s Problematic: Not all Hanging Men are created equal:
- Hanging Man with volume + resistance + confirmation = high probability
- Hanging Man alone without confluence = lower probability
The Fix:
- Grade each setup: A, B, or C quality
- A-quality (multiple confluence): 2% risk
- B-quality (some confluence): 1.5% risk
- C-quality (minimal confluence): 1% risk or skip
Mistake 6: Forgetting About Failed Patterns
The Problem: No plan for what to do when Hanging Man fails and uptrend continues.
Why It’s Dangerous:
- Hanging patterns fail 30-40% of the time even with confirmation
- Failed patterns often lead to explosive moves upward
- Staying short during failed pattern is costly
The Fix:
- Always use stops
- If price closes above Hanging Man high, pattern has failed
- Exit immediately, don’t hope for recovery
- Consider reversing to long if stop hit with volume
Hanging Man Candlestick Pattern vs. Similar Patterns
Hanging Man vs. Hammer
| Aspect | Hanging Man | Hammer |
| Structure | Identical | Identical |
| Context | Top of uptrend | Bottom of downtrend |
| Interpretation | Bearish reversal | Bullish reversal |
| Body Color | Either (slight preference bearish) | Either (slight preference bullish) |
| Reliability | 60-65% with confirmation | 60-70% with confirmation |
Key Insight: Same candle, opposite meanings based purely on location. This is why trend identification comes BEFORE pattern identification.
Read: Hammer Candlestick Pattern
Hanging Man vs. Shooting Star
| Aspect | Hanging Man | Shooting Star |
| Body Location | Top of range | Bottom of range |
| Long Shadow | Lower shadow | Upper shadow |
| Context | Top of uptrend | Top of uptrend |
| Interpretation | Bearish reversal | Bearish reversal |
| Shadow Direction | Downward | Upward |
Comparison:
- Both are bearish reversal patterns at trend tops
- Shooting Star generally considered slightly more bearish
- Shooting Star shows bulls tried to push higher and completely failed
- Hanging Man shows bears tried to push lower and partially failed
- Both require confirmation
Read: Shooting Star Candlestick Pattern
Hanging Man vs. Inverted Hammer
| Aspect | Hanging Man | Inverted Hammer |
| Context | Uptrend | Downtrend |
| Shadow | Long lower | Long upper |
| Meaning | Bearish warning | Bullish warning |
| Body | Top of range | Bottom of range |
Read: Inverted Hammer Candlestick Pattern
Hanging Man vs. Doji
Major Difference:
- Doji has virtually NO body (open equals close)
- Hanging Man has small but definite body
- Both show indecision but Doji is more extreme
Trading Implications:
Doji needs more confirmation than Hanging Mannter a short position at the closing price of this candlestick or at the opening price of the next bearish candlestick. Regular Doji is neutral; Hanging Man has bearish bias.
Doji + long lower shadow at uptrend top = Dragonfly Doji (similar to Hanging Man)
Read: Doji Candlestick Pattern
The Hanging Man candlestick pattern is a valuable tool for identifying potential trend reversals, but it’s not a magic bullet. Success with this pattern requires:
Critical Success Factors
- Pattern Recognition: Accurately identify valid patterns (not every small-bodied candle is a Hanging Man)
- Context Awareness: Understand the prior trend and market conditions
- Patience for Confirmation: Never trade before receiving bearish confirmation
- Risk Management: Always use stops, proper position sizing, and risk-reward analysis
- Realistic Expectations: Accept 60-65% win rate and focus on process over outcomes
Path to Mastery
Beginner Phase (Months 1-3):
- Study pattern identification on historical charts
- Paper trade every potential setup
- Track results without risking capital
- Learn to wait for confirmation
Intermediate Phase (Months 4-9):
- Begin live trading with small position sizes
- Focus on daily timeframe, liquid stocks only
- Combine with 1-2 indicators for confluence
- Refine entry and exit timing
Advanced Phase (Months 10+):
- Develop personal variations and filters
- Expand to different timeframes
- Integrate with overall trading system
- Optimize based on tracked performance data
Integration into Complete System
The Hanging Man should be one tool in your trading toolbox, not your entire strategy. Combine it with:
- Other candlestick patterns (Evening Star, Bearish Engulfing)
- Chart patterns (Double Tops, Head and Shoulders)
- Support and resistance analysis
- Trend and momentum indicators
- Fundamental analysis (for longer-term trades)
Final Reminder
No single pattern, including the Hanging Man, works 100% of the time. The goal is not perfection but consistent application of an edge over many trades. With proper education, practice, and discipline, the Hanging Man can become a reliable component of a profitable trading system.
Remember: The market doesn’t care about your interpretation of a pattern. It only cares about supply and demand. The Hanging Man simply helps you identify moments when supply (selling pressure) might be overcoming demand (buying pressure). Use it wisely, confirm it thoroughly, and manage your risk religiously.
Read More- All 35 Candlestick Chart Patterns in the Stock Market
Frequently Asked Questions (FAQs)
1. Is Hanging Man Bullish or Bearish?
A bearish candlestick pattern appears following a price increase. A few price bars moving higher overall should make up at least part of the advance, no matter how big or tiny. The true body of the candle must be small, and its shadow must be at least twice as long as the genuine body.
2. Is Hanging Man the Same as Doji?
A Doji and pattern are a comic parable, but the hanging man has a body. It comes in two criteria: bearish and bullish.
3. How long should I wait for Hanging Man Candlestick confirmation?
Wait for the next trading session’s close.
4. What’s the success rate of Hanging Man patterns?
Success rate varies dramatically based on filtering and confirmation requirements. Strict criteria = higher success but fewer trades.


PL.CONTINUE THESE ABOUT CANDELSTIC PATTERN….N EXPLAIN 2 EFUCATE INVESTORS.
Hi,
We are glad that you like our blog post. Please do read more blogs on Technical Analysis.
Thank you for Reading!
This is very interesting and educative piece
Hi,
We really appreciated that you liked our blog!
Thank you for Reading!
Keep Reading!