Bank Nifty opened above its 5 Day Low EMA (24659 approx)on the 22nd September.
The Index fell by 369 points and closed below its 34 DMA (24369 approx).
Hourly Technicals:
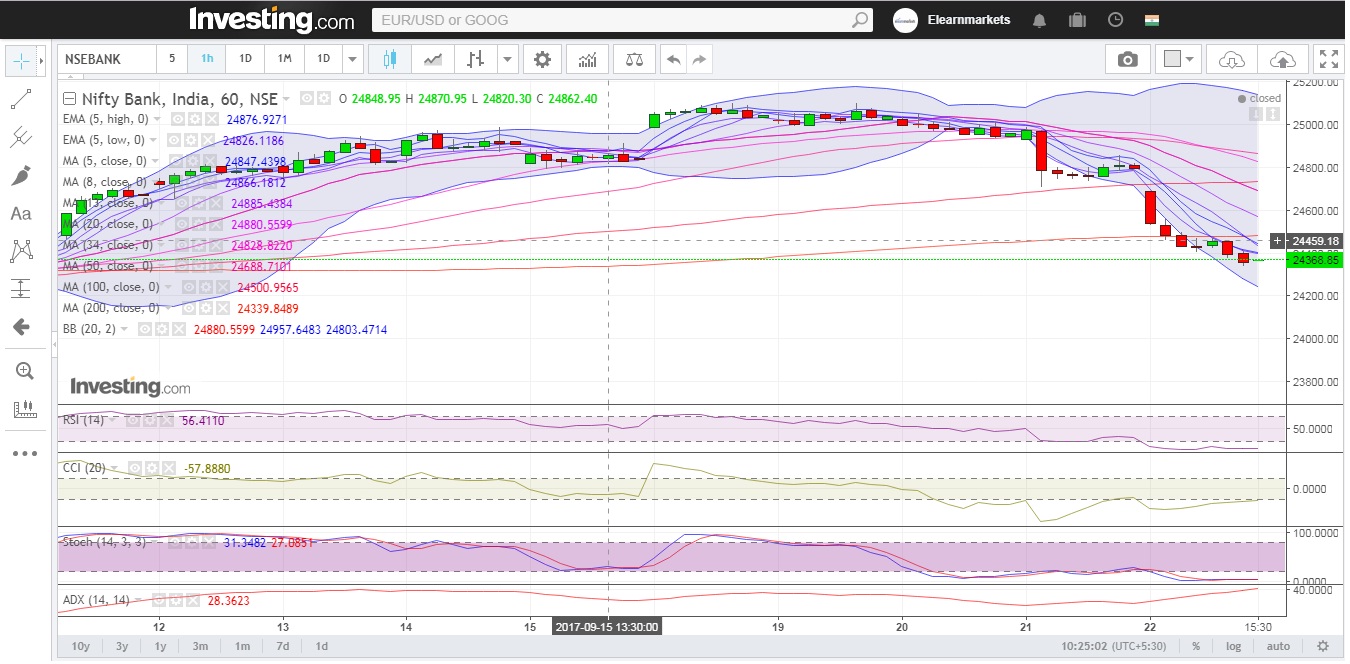
In the Hourly Chart, Bank Nifty has closed below its 5 hourly low EMA of (24398 approx).
The Index is likely to face multiple resistance above the 5DMA (24403 approx) mark.
If Bank Nifty breaks and closes below the lower end of the Bollinger band( 24244 approx), the next support area will be 23840.
Hourly RSI stands below the normal range. CCI, however, shows that sentiments might are highly negative.
The ADX is indicating that volatility is on the cards.
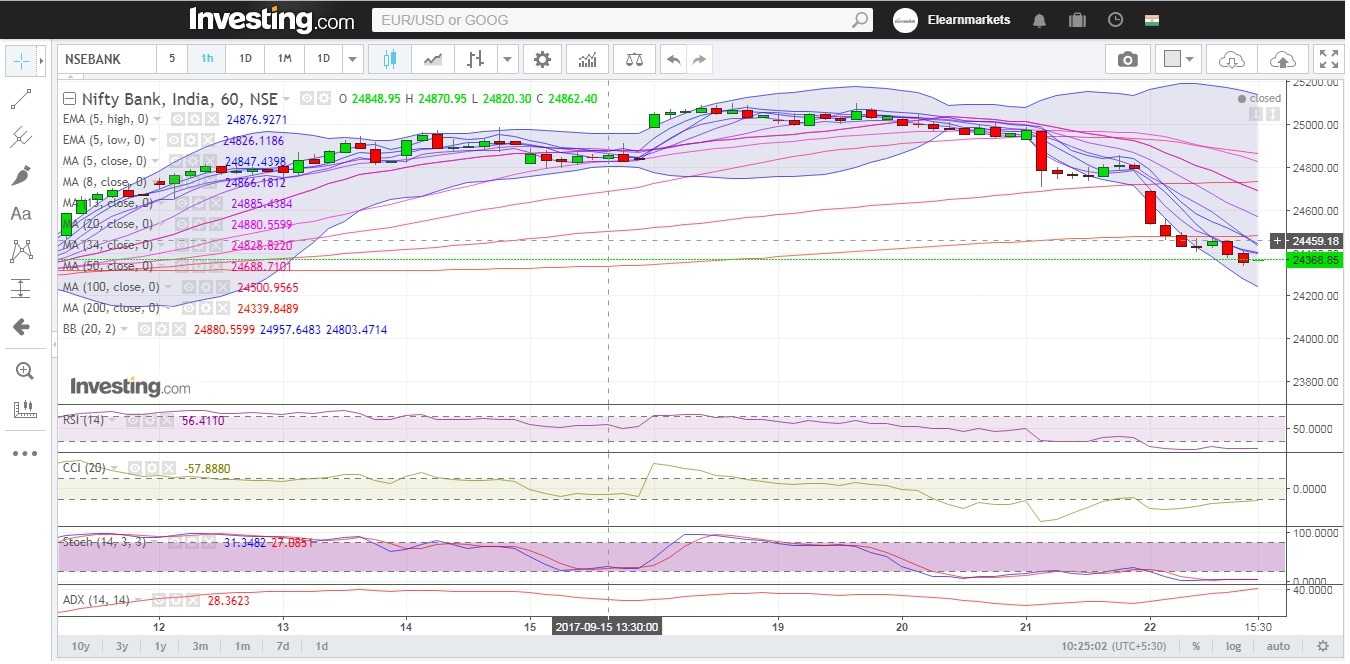
Figure: Bank-Nifty Hourly Chart
Daily Technicals:
The daily chart indicates that Bank Nifty has closed below its 34 DMA of (24369 approx).
The Index has broken below its 50DMA mark, the next support area will be around the 100 DMA mark(23840 approx).
On the downside, however , Bank Nifty has to fall by 528 points before it finds the next support zone.
The daily RSI has closed midway between the normal range.
The CCI, however, has fallen below the normal range.
The ADX indicates that momentum might be picking up.
Learn Technical Analysis in NSE Academy Certified Technical Analysis course.
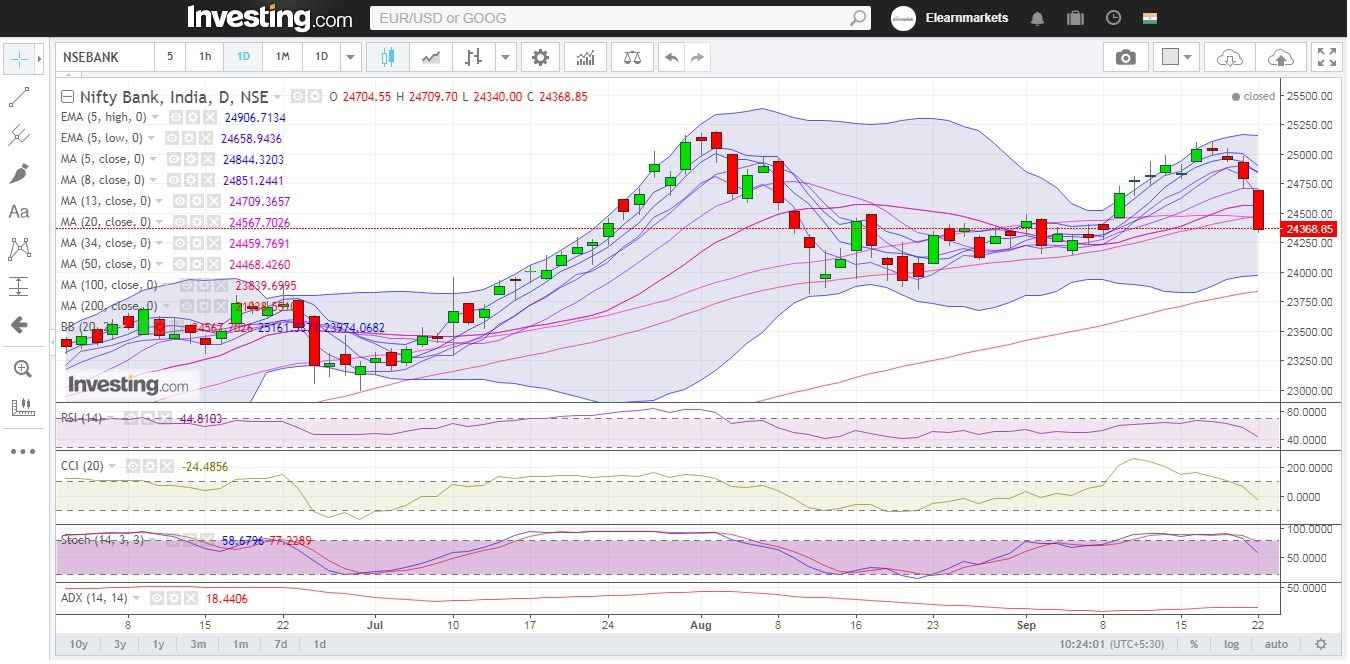
Figure: Bank-Nifty Daily Chart
Weekly Technicals:
In the Weekly Chart, Bank Nifty has closed below its 8 weekly MA of (24397 approx).
The Index is likely to face immediate resistance around is 5 weekly MA (24458 approx) mark.
If Bank Nifty breaks below its 13-week moving average (24219 approx), the next support area will be around the 20-week moving average(23888 approx).
Weekly RSI and CCI stand at the higher end of the normal range.
The ADX is indicating that volatility is on the cards.
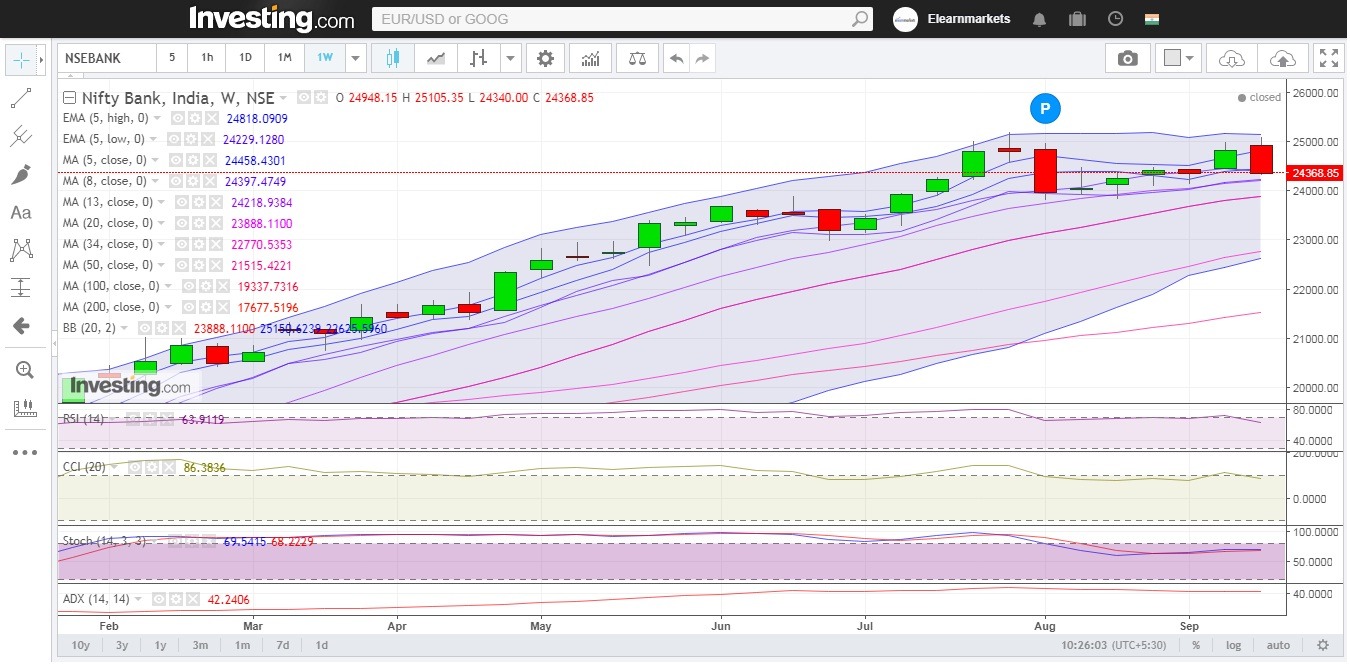
Figure: Bank-Nifty Weekly Chart
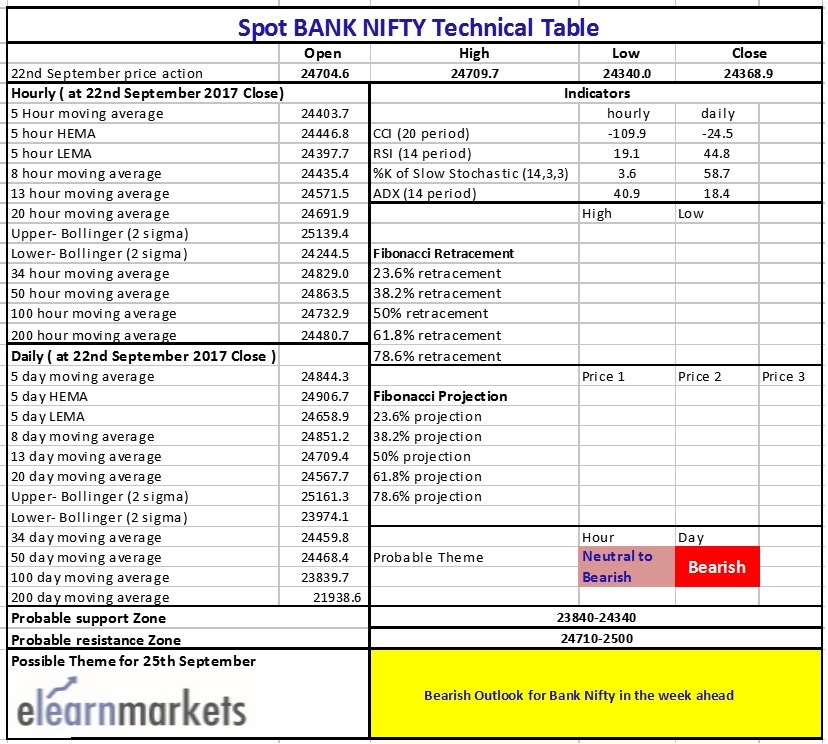
Figure: Bank-Nifty Tech Table
Watch the video below to know how to analyze the above table:
