Elearnmarkets - Financial Market Learning
  • Courses
  • Webinars
  • Stories
  • Language
    • English
    • Hindi
    • Bengali
No Result
View All Result
Get Free Course
  • Basic Finance
  • Derivatives
    • Futures
    • Options
  • Financial Planning
  • Fundamental Analysis
  • Technical Analysis
  • Mutual Funds
  • Marketshala
  • Miscellaneous
Elearnmarkets - Learn Stock Market, trading, investing for Free
  • Courses
  • Webinars
  • Stories
  • Language
    • English
    • Hindi
    • Bengali
No Result
View All Result
Get Free Course
Elearnmarkets - Learn Stock Market, trading, investing for Free
No Result
View All Result
Home Technical Analysis
How to trade using ADL

How to get trading signals using Accumulation Distribution Line (ADL)?

Elearnmarkets by Elearnmarkets
October 1, 2024
in Technical Analysis
Reading Time: 3 mins read
5
4.7k
VIEWS
Share on FacebookShare on XShare on WhatsApp

Just like in a game of Cricket, a player can really play very well if he understands the psychology of the bowler rather than simply keeping an eye on the ball. In the same way, if we analyze the mentality of buyers and sellers, we will be able to trade more efficiently and effectively in market, than by simply looking at the price.

In order to tackle this problem, we should look for volume based indicator which tells us about the pocket of strength and where the big money is actually flowing. When we talk about Volume based indicator, the first name that comes to our mind is Accumulation Distribution Line (ADL). Click here to do NSE Academy Certified Technical Analysis course to learn basics of Technical Analysis and also various trading strategies.

Accumulation Distribution Line (ADL) is a volume-based indicator, developed by Marc Chaikin which is designed to measure the cumulative flow of money into and out of a security. Chartists often can use this indicator to know about security’s underlying trend or anticipate reversals when the indicator diverges from the security price.

Calculation

There are basically three steps in calculating Accumulation Distribution Line (ADL) which are as follows-

1. Calculate Money Flow Multiplier.

Money Flow Multiplier = [(Close – Low) – (High – Close)] /(High – Low)

Read More:  How to generate trading signals using Money Flow index and 100 DMA?

2. Multiply the above value by volume to find the Money Flow Volume

Money Flow Volume = Money Flow Multiplier x Volume for the Period

3. Maintain a running total of Money Flow Volume to form the Accumulation Distribution Line (ADL)

ADL = Previous ADL + Current Period’s Money Flow Volume

Also Read: How to generate powerful trading signal using Parabolic SAR and RSI?

Interpretation

The Money Flow Multiplier actually fluctuates between +1 and -1. When the close is in the upper half of the high-low range, the multiplier is positive, which indicates that buying pressure is intense and much stronger than selling pressure. On the other hand, when the close is in the lower half of the high-low range, the multiplier is negative, which indicates that selling pressure is stronger than buying pressure. The ADL line falls when the multiplier is negative and rises when the multiplier is positive.

How to trade using Accumulation Distribution Line (ADL)?

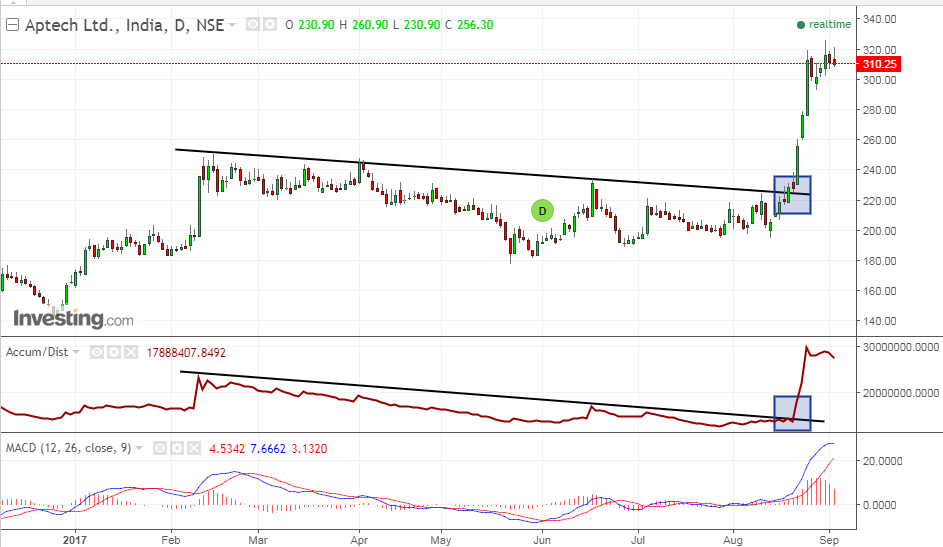
We should look for stocks where the Accumulation Distribution Line (ADL) is above zero.

Let’s take an example to understand this. Below is the chart of Aptech ltd., which was trading above zero for quite a long time. After making a fresh high, the stock went into consolidation and gave a little correction as seen from the downtrend resistance. The scenario was very similar as with Accumulation Distribution Line. The break above the resistance line led to massive buying in the stock which was also confirmed by rising MACD line.

Accumulation Distribution Line

Bottomline

Chartist also add moving average to Accumulation Distribution Line (ADL) to filter their trades. Moreover, one should not add ADL in isolation, rather it should be used in junction with other technical parameters for confirmed signals.

In order to get the latest updates on Financial Markets visit stockedge

Tags: Accumulation Distribution Lineenglishtechnical analysis
ShareTweetSend
Get Kotak Offer Get Kotak Offer Get Kotak Offer
Previous Post

Bank Nifty Slips 200 Points, Bears On the Prowl

Next Post

Nifty Reclaims 9950 With Upward Bias

Elearnmarkets

Elearnmarkets

Elearnmarkets (ELM) is a complete financial market portal where the market experts have taken the onus to spread financial education. ELM constantly experiments with new education methodologies and technologies to make financial education effective, affordable and accessible to all. You can connect with us on Twitter @elearnmarkets.

Related Posts

Understand Slippage in Trading
Technical Analysis

What is Slippage in Trading? Meaning & Examples

March 28, 2025
297
Breakout trading strategies
Technical Analysis

Top 5 Breakout Trading Strategies

March 12, 2025
1.1k
5 stocks for today
Technical Analysis

5 Stocks to Buy Today That Could Beat the NIFTY in 2025!

May 5, 2025
398
Image describing What is marginal trading facility
Technical Analysis

 What is a Margin Trading Facility? Advantages & Risks

April 4, 2025
661

Comments 5

  1. abhijat says:
    8 years ago

    Good Info..

    Reply
  2. Jason says:
    7 years ago

    I am using accumulation distribution line on a 15 min chart. I noted that the trend is up with the line sloping upwards in agreement with price action But during a period of retracement I noted the ADL showed momentarily several sharp downward spiral but then reverted to the upward slope.
    I believe this is caused by short selling as price went further up.
    What is your take of my comments.

    Reply
    • Tista Sengupta says:
      7 years ago

      Hello Jason

      Thank you for your comment.

      We are an educational institute and hence are not authorized to advise on trading.

      To get a better understanding of different concepts of Techncial Analysis:you may do: NSE Academy Certified Technical Analysis

      Happy Learning!

      Reply
  3. Tommy Hornig says:
    6 years ago

    Thanks for the great info! Looking forward to more updates on this.

    Reply
    • Sakshi Agarwal says:
      6 years ago

      Hi,

      Thank you for reading!

      For receiving updates on our new posts please register on our blog page!

      Keep Reading!

      Reply

Leave a Reply Cancel reply

Your email address will not be published. Required fields are marked *

Disclaimer

Elearnmarkets (Kredent InfoEdge Pvt. Ltd.) is a SEBI-registered Research Analyst (RA) entity (SEBI Registration No.: INH300007493). The information provided in this article is for educational and informational purposes only and should not be considered as an offer to buy or sell any securities or investment products.

The stocks, securities, and investment instruments mentioned herein are not recommendations under SEBI (Research Analysts) Regulations, 2014. Readers are advised to conduct their own due diligence and seek independent financial advice before making any investment decisions.

Investments in securities markets are subject to market risks. Please read all related documents carefully before investing. Investing in Equity Shares,
Derivatives, Mutual Funds, or other instruments carry inherent risks, including potential loss of capital. Elearnmarkets (Kredent InfoEdge Pvt. Ltd.) does not provide any guarantee or assurance of returns on any investments. Past performance is not indicative of future performance.

Elearnmarkets Logo

Follow Us

Facebook-f X-twitter Instagram Linkedin-in Youtube Telegram

Register on Elearnmarkets

Continue your financial learning by creating your own account on Elearnmarkets.com

Register Free Account

Download App

Playstore logo
Download on app store

Categories

  • Basic Finance
  • Derivatives
  • Financial Planning
  • Fundamental Analysis
  • Technical Analysis
  • Mutual Funds
  • Miscellaneous

Popular On Elearnmarkets

  • Market Superheroes:
  • Vivek Bajaj
  • Chetan Panchamia
  • Ashish Kyal
  • Premal Parekh
  • Abhijit Paul
  • Jegan
  • Sivakumar Jayachadran
  • Jyoti Budhia
  • Vivek Gadodia
  • Vishal Mehta
  • Piyush Chaudhry
  • Santosh Pasi
  • Gomathi Shankar
  • Market Superheroes:
  • Vivek Bajaj
  • Chetan Panchamia
  • Ashish Kyal
  • Premal Parekh
  • Abhijit Paul
  • Jegan
  • Sivakumar Jayachadran
  • Jyoti Budhia
  • Vivek Gadodia
  • Vishal Mehta
  • Piyush Chaudhry
  • Santosh Pasi
  • Gomathi Shankar
  • Courses:​
  • Options Trading
  • Dow Theory
  • Momentum Trading
  • Stock Investing
  • Harmonic Chart Patterns
  • Algo Trading
  • Elliot Wave Theory
  • Advanced Excel
  • Cryptocurrency
  • NSE Certification Course
  • Courses:​
  • Options Trading
  • Dow Theory
  • Momentum Trading
  • Stock Investing
  • Harmonic Chart Patterns
  • Algo Trading
  • Elliot Wave Theory
  • Advanced Excel
  • Cryptocurrency
  • NSE Certification Course
  • Webinars:
  • Bank Nifty Scalping
  • Intraday Trading Strategies
  • Options Trading Strategies
  • Options selling
  • Price Action
  • Relative Strength
  • Tax Planning
  • Options Buying
  • Growth Stocks
  • Portfolio Management
  • Risk Management
  • Renko Charts
  • Crude Oil
  • Traders Psychology
  • Moving Average
  • Multibagger Stocks
  • Free Learning Modules:
  • Intraday Trading
  • Options Scalping
  • Swing Trading
  • Financial Modelling
  • RSI Indicator
  • Bollinger Bands
  • Pricing of Futures
  • Personal Finance
  • Initial Public Offerings (IPO)
  • Value Investing
  • Technical Indicators
  • Candlesticks
  • Chart Patterns
  • Option Greeks
  • ELSS Funds
  • Banking and Insurance
  • Real Estate
  • Gold
  • Book Summaries:
  • Rich Dad Poor Dad
  • Psychology of Money
  • The Intelligent Investor
  • The Richest Man in Babylon
  • Think and Trade Like a Champion
  • Value Investing and Behavioural Finance
  • Trading in the Zone
  • Learn to Earn
  • Book Summaries:
  • Rich Dad Poor Dad
  • Psychology of Money
  • The Intelligent Investor
  • The Richest Man in Babylon
  • Think and Trade Like a Champion
  • Value Investing and Behavioural Finance
  • Trading in the Zone
  • Learn to Earn
  • Tools:
  • CAGR Calculator
  • SIP Calculator
  • eLearnOptions
  • Future Value Calculator
  • Present Value Calculator
  • Atal Pension Yojana
  • Cost of Delay Calculator
  • Become a Crorepati
  • Tools:
  • CAGR Calculator
  • SIP Calculator
  • eLearnOptions
  • Future Value Calculator
  • Present Value Calculator
  • Atal Pension Yojana
  • Cost of Delay Calculator
  • Become a Crorepati

© 2025 Elearnmarkets. All Rights Reserved

  • Visit Elearnmarkets
  • Courses
  • Webinars
  • Financial Guides
  • Get Free Counselling
  • Visit Elearnmarkets
  • Courses
  • Webinars
  • Financial Guides
  • Get Free Counselling

Download Our App

No Result
View All Result
  • Article Categories
    • Basic Finance
    • Derivatives
    • Financial Planning
    • Fundamental Analysis
    • Technical Analysis
    • ETFs & Mutual Funds
    • Marketshala
    • Miscellaneous
  • Language
    • Hindi
    • Bengali
    • English
  • Courses
  • Webinars
  • Stories
Get Free Course

© 2024 Elearnmarkets All Rights Reserved

A Handbook of Technical Analysis
To start your trading journey as a seasoned technical analyst
Download Guide For FREE
Trading Mentorship Program