People often question which is better, Fundamental Analysis or Technical Analysis? Best is to work with both these analysis together. When we combine the strengths of both of these analyses, it helps the investor to create bigger wealth. It also helps the investors to get a better direction of the market. Let us first discuss what these analyses are and then we will discuss how to work with both in synergy.
What is Fundamental Analysis?
Fundamental analysis is the stock valuation method which uses micro economics and financial data to analyse stock movements. The result of fundamental analysis is to find an intrinsic value for a stock for better wealth creation. To a fundamental investor, the market price of a stock tends to revert towards its intrinsic value.
If the intrinsic value of a stock is above the current market price, then the investor would purchase the stock because he believes that the stock price would rise and move towards its intrinsic value. If the intrinsic value of a stock is below the market price, then the investor would sell the stock because he believes that the stock price is going to fall and come closer to its intrinsic value.
Aspects of Fundamental Analysis
Fundamental Analysis uses both financial and non financial aspects of the company and also the macros of the industry as a whole. Financial aspect can be done by analyzing financial data of the company which can be found in the annual reports of the company. Non financial aspect uses information such as estimates of its growth, demand for products sold by the company, industry comparisons, economy-wide changes, changes in government policies etc.
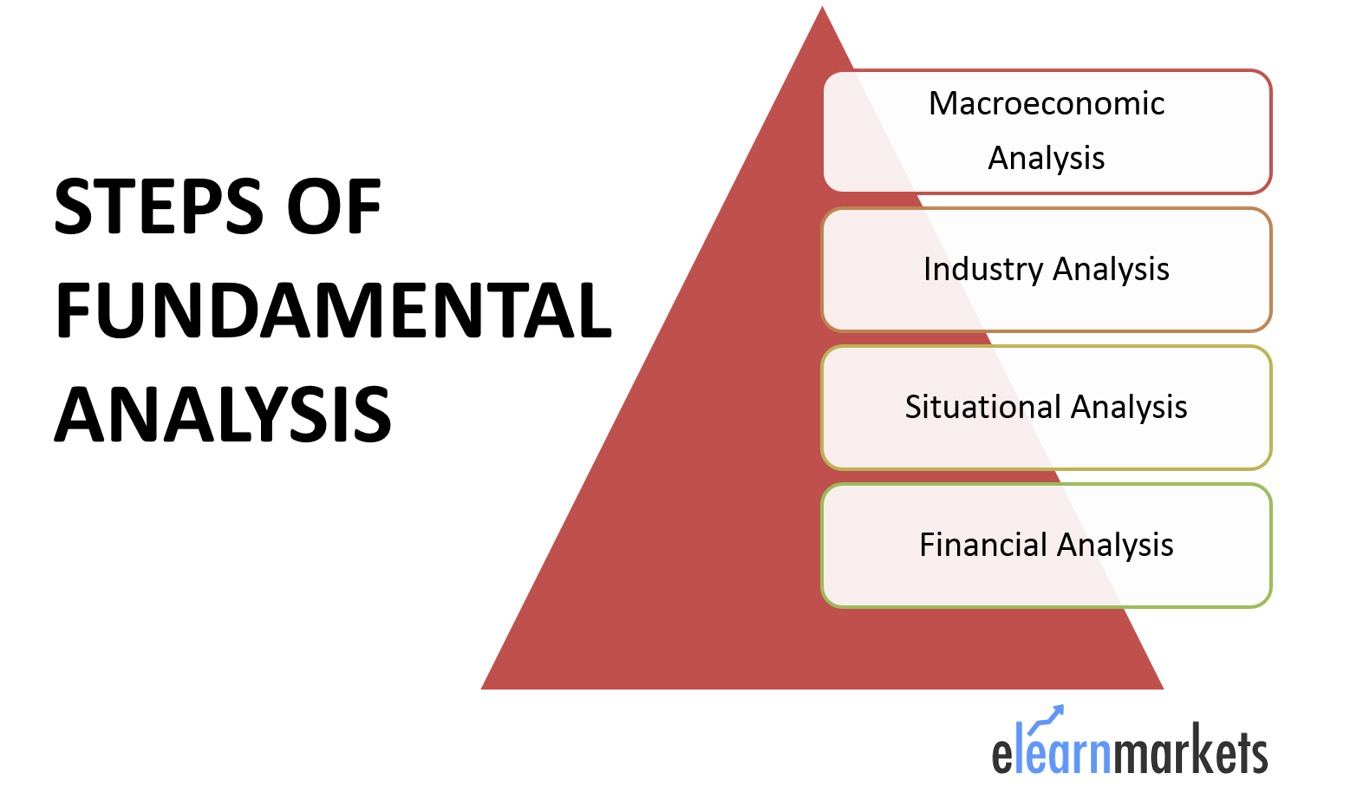
Steps of Fundamental Analysis
Fundamental analysis consists of a systematic series of steps to examine the investment rationale of a company and then identify opportunities. Some of these are:
- Macroeconomic analysis – which involves analyzing capital flows, interest rate cycles, currencies, commodities, indices, world geography etc.
- Industry analysis – which involves the analysis of the industry and the companies that form a part of that sector.
- Situational analysis of a company means the parameter that impacts the business of the company.
- Financial analysis comprises of all the Financial Statements of the Company.
Analysis of Financial Statement:
The financial performance or the numbers of a company, as presented in the financial statements, can be used to calculate ratios that give a snapshot review of the company’s performance. Some of the important ratios of the company are:
Debt/ Equity (D/E)
Higher debt in a business can prove to be a detrimental for a company. In absence of its ability to pay to the lenders, businesses may have to face bankruptcy. When businesses tend to thrive on borrowed money, then it could be quite dangerous if the assets are unable to generate the expected revenues and profitability.The liability will still have to be met whether or not the businesses thrive.
Become expert trader with Technical Trading Made Easy with Market Experts
EBITDA Margin
This ratio is useful in finding out the profitability of the company’s business operations, purely based upon its optimisation of direct costs to generate higher revenues. It helps one to understand if the company is able to generate cash from its sales after meeting all its operating expenses or not.
Return on Equity (ROE)
ROE communicates how effectively a business allocates its capital to generate return. An efficient allocator of capital would have high ROE and a poor quality of capital allocation in a business to have low ROE. This ratio means how much percentage of return is generated on the equity used.
Current Ratio
This ratio measures the company’s liquidity situation by comparing its current assets with its current liabilities. A ratio of more than 1 means that the company’s current assets are more than current liabilities. This ratio can also be used to ascertain Working Capital Ratio. A ratio less than 1 will raise question about the solvency of the company.
Asset Turnover
This ratio indicates how many times the assets of the business are put to use to generate revenues for the business. If assets are lying idle, then that’s not good for the business as capital deployed is not generating any revenue. On the other hand, if asset is continuously put to use to produce goods and services, it would improve the revenues and the profits. Therefore, higher the ratio, better the firm.
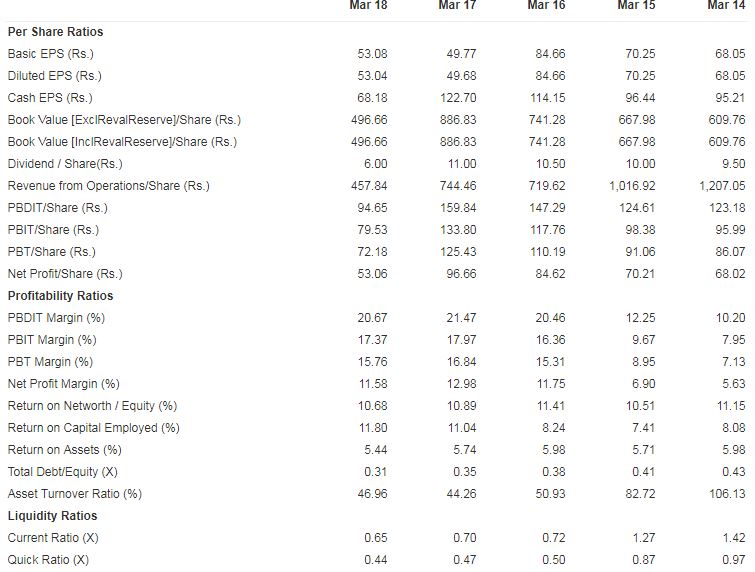
Source: Moneycontrol.com
What is Technical Analysis?
Technical analysis involves plotting stock information like prices, volumes and open interest on a chart and applying various patterns and indicators to it in order to assess the future price movements. The time frame to which technical analysis is applied can be for intraday (1-minute, 5-minutes, 10-minutes, 15-minutes, 30-minutes or hourly), daily, weekly or monthly. The price data is studied from the historic point of view to arrive at any conclusion or target for any stock, commodity or Indices.
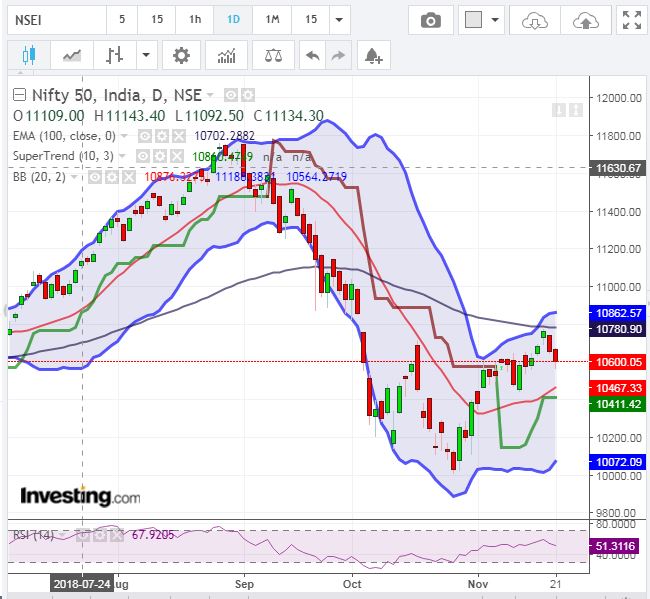
Technical Analysis Indicators:
Moving averages
The mostly used trend-following indicator for technical analysis is the moving averages. They, from a data series make it easier to spot trends, something that is especially helpful in volatile markets. They also form the base indicator for application of many more technical indicators and overlays. Normally stocks above 50 dma are considered bullish and below 200 dma are considered bearish. After the breach of any of the moving averages the momentum on either side becomes very swift and fast.
Relative Strength Index (RSI)
RSI is a momentum oscillator generally used in sideways or ranging markets where the price moves between support and resistance levels. Relative Strength Index is one of the most useful technical tool employed by many traders to measure the velocity of directional price movement. It helps to understand whether the stock is overbought or oversold. As any reaction from overbought and oversold levels are generally very fierce and fast. RSI above 70 is considered to be overbought and RSI below 30 is considered to be oversold.
Bollinger Bands
Bollinger bands are trading bands developed by John Bollinger. It consists of a 20 period simple moving average with upper and lower bands. The upper band is 2 standard deviation above the moving average and similarly lower band is 2 standard deviation below the moving average. This makes Bollinger bands more dynamic and adaptive to volatility. Stocks moving between the bands are good trading bets.

Money Flow Index
Money flow index takes into account volume action and on the basis of volume action; it attempts to measure the strength of money flowing in and out of the security which now a days is also known as smart money flow indicator.
How to make right investing decisions using both fundamental and technical analysis together?
We have discussed the basics of technical and fundamental analysis. Now let us discuss how we can take investment decisions using both the type of analysis:
Fundamental is basically a background check of how companies operated and performed in the past years and what can be their future in the coming years. By fundamental analysis we can judge whether the company will grow in the future or not, whether the company can pay regular dividend or not or whether the company is growth oriented and dynamic or not. We can select good companies for long term investments through fundamental analysis.
After selecting the company through fundamental analysis, we can use technical analysis to enter into the stock for investment using technical indicators. Technical indicators give us buy and sell signals of the stock. By using Technical Indicators we can enter the trade when the price is low. If we want to invest for short term then technical indicators give us buy and sell signals for short term trends.
For example, we can use screener to fundamentally select a stock. Stockedge App gives us fundamental parameters about the company. We can also compare the company with its peers also. We should select a fundamentally strong company because if the company becomes bankrupt then we can make huge losses. After selecting the company, at which price to enter is a crucial factor, for that we can use Technical indicators.
Bottomline
Technical analysis of stocks is a useful way for stock analysis; it has benefits as well as limitations. Same goes with fundamental analysis. If we use the strength of both the analysis then we can have good growth in our investments.


I’ve read a few excellent stuff here. Definitely value bookmarking for revisiting. I wonder how so much attempt you place to create this kind of wonderful informative site.