Understanding the fundamentals of the company from the financial statements and the reports published is always a challenge for investors. There are plethora of things related to the figure in financial statements.
And, it is always difficult to choose as to what to analyse from them.
In this blog, we will understand as to what does the financial statement comprise of and what should an investor choose for his analysis.
In case you want to learn this section elaborately, you can always refer to the basic and advanced understanding of financial statements.
Financial statements comprises of:

The above statements are accompanied by “notes to financial statements” which contains details of the financial statements apart from additional information related to the financial statement of the company.
Figures can be analyzed in two ways:
- Ratios Analysis,
- Growth rates.
Analysis of Financial Statements
Statement of Profit and Loss
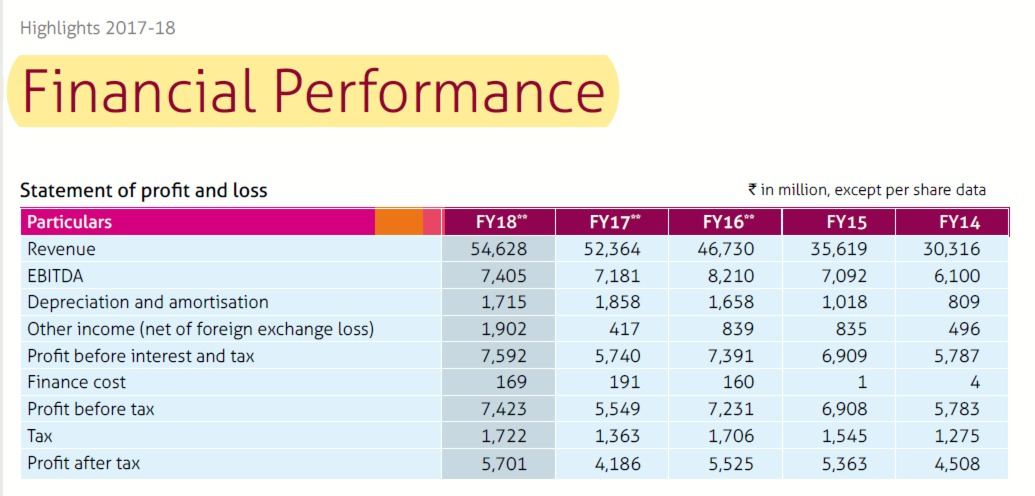
For understanding this section, we have taken a snippet of the financial performance of the company as shown below:

Sales/ Revenue
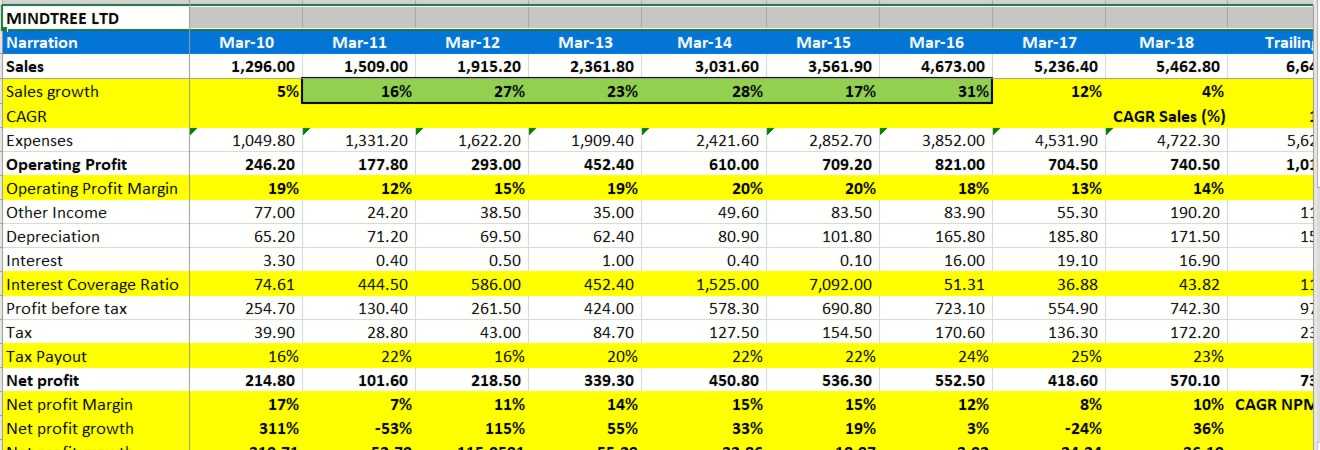
In statement of profit and loss, we will first look at sales growth. To check growth, we will need data of at least 5 or 10 years. In that way we can track the growth rate. Calculate compounded annual growth rate (CAGR) for 5 or 10 years.
The growth rate should be at or above par in that industry to be considered as a good growth rate.
The formula to calculate CAGR is :
CAGR = (EV/ BV)1/n – 1
where:
- EV = Investment’s ending value
- BV = Investment’s beginning value
- n = Number of periods (years)
Do it yourself: You can take the Revenue data from the above excerpt and calculate the CAGR of the revenue component by yourself.
Profitability
For checking the operating performance (i.e. main business operation), we will check EBITDA margin (Earnings before Interest, Tax, Depreciation, Amortization) or operating margin.
We can check the growth in operating profit over the years. We can compare the operating profit margin with similar companies.
To check the overall profitability of the company, we will calculate net profit margin.
Net Profit margin = Net Profit/ Sales
We can calculate the growth in net profit over the years and also compare it with similar companies.
Interest coverage
If the company has a lot of debt, then this ratio becomes really important. It shows how comfortably can the profit of the company meet its interest expenses.
Interest coverage ratio = EBIT (Earnings before Interest and tax)/Interest expense
We can analyze the components of P&L, in terms of percentage of sales. By, this, we will know which aspect of the company has maximum expense (include pic) and impact on profitability.

Brief read: How to Analyse Financial Statements of a Company
Analysis of Balance Sheet Figures
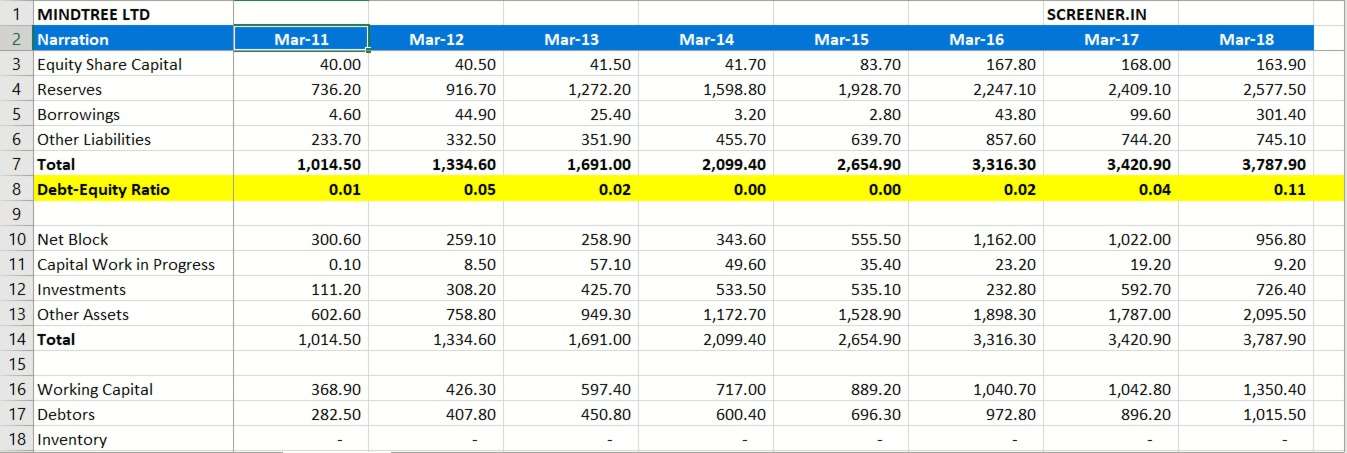
Debt Equity ratio
This measure tells us how much of borrowed capital is used in the business as compared to shareholders’ capital. Ideally lower debt is preferred because in difficult times, it might become difficult to service the debt.
Debt Equity Ratio = Total Debt/ Equity Shareholder’s fund.

Current Ratio
= Current assets/ current liabilities
It is ratio of current assets to current liabilities. This is a measure of liquidity of the business. We check whether the current assets are enough to meet the current liabilities. A ratio of below 1 can be a sign of worry from liquidity perspective.
Current assets and current liabilities also give us idea about the working capital requirement of the company.
Analysis of cash flow statement
Cash flow statement tells us about the actual inflow of cash. It is divided into 3 parts- cash flow from operating activities, investing activities and financial activities.
Operating activities : Cash flow from operating activities shows the cash inflows coming from main business of the company. Most of the time, the operating profit and cash flow does not match because there are receivables and non-cash items. Cash flow statement tells us actual cash generating ability of the business.
A company generating positive and higher operating cash flow is always good.
Investing activities: Cash flow from investing activities shows outflows in terms of capital expenditure and inflows from investments and sale of assets.
Financing activities: Cash flow from financing activities shows issue or redemption of capital, dividend paid, etc.
Overall positive cash flow is good for a company.

Key takeaways
- Financial statements are huge to study but are replica of the performance of the company.
- These key financial statements contain the numbers that matters the most in fundamental analysis.
- Always keep ratios and growth pattern in mind before analyzing any companies fundamentals.
- All the three statements under financial statements are inter-linked to one another.
- Always try to consider the data of atleast 3 or 5 or 10 years to get a clear picture of the growth pattern of the company.
Learn excel through our advanced excel course with certification and enhance your financial skills.
Is the language a barrier? Then join our advanced excel full course in hindi now!


