Since time immemorial when Adam was tempted for the apple to go to the Tree of Knowledge until the very present moment we can clearly identify that Nature herself advertises on the earth we live, the stars, the planet suspended within our view, in the elements above and around us, in every blade of grass, and every form of life within our vision in a proper numbering system.
Can you guess what I am talking about? You don’t have to be specialized in mathematics to understand this.
If I could, why not you? Yes, it’s very simple. I am talking about Fibonacci numbers.
Laughing… I know it’s a familiar term for you. By now you must have understood that the topic for today’s blog is “Fibonacci and Stock Market Analysis“.
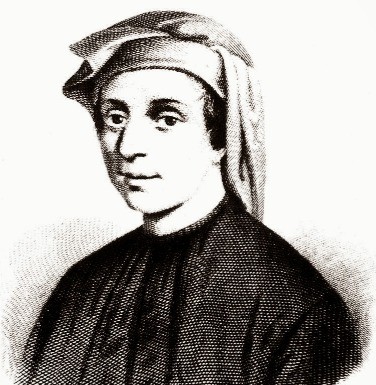
In the 12th century an Italian mathematician named Leonardo Bonacci who is considered to be “the most talented Western mathematician of the Middle Ages“, wrote Liber Abaci and popularized the Hindu-Arabic numeral system to the Western world.
Table of Contents
Before arousing any curiosity in your conscious mind, I want to speculate a bit on “Liber Abaci”.
Let me quote from Wikipedia “In the Liber Abaci (1202), Fibonacci introduced the so-called modus Indorum (method of the Indians), today known as Hindu-Arabic numerals. The book advocated numeration with the digits 0–9 and place value. The book showed the practical use and value of the new Arabic numeral system by applying the numerals to commercial bookkeeping, converting weights and measures, calculation of interest, money-changing, and other applications. The book was well-received throughout educated Europe and had a profound impact on European thought. No copies of the 1202 edition are known to exist”
Do you know Fibonacci Sequence?
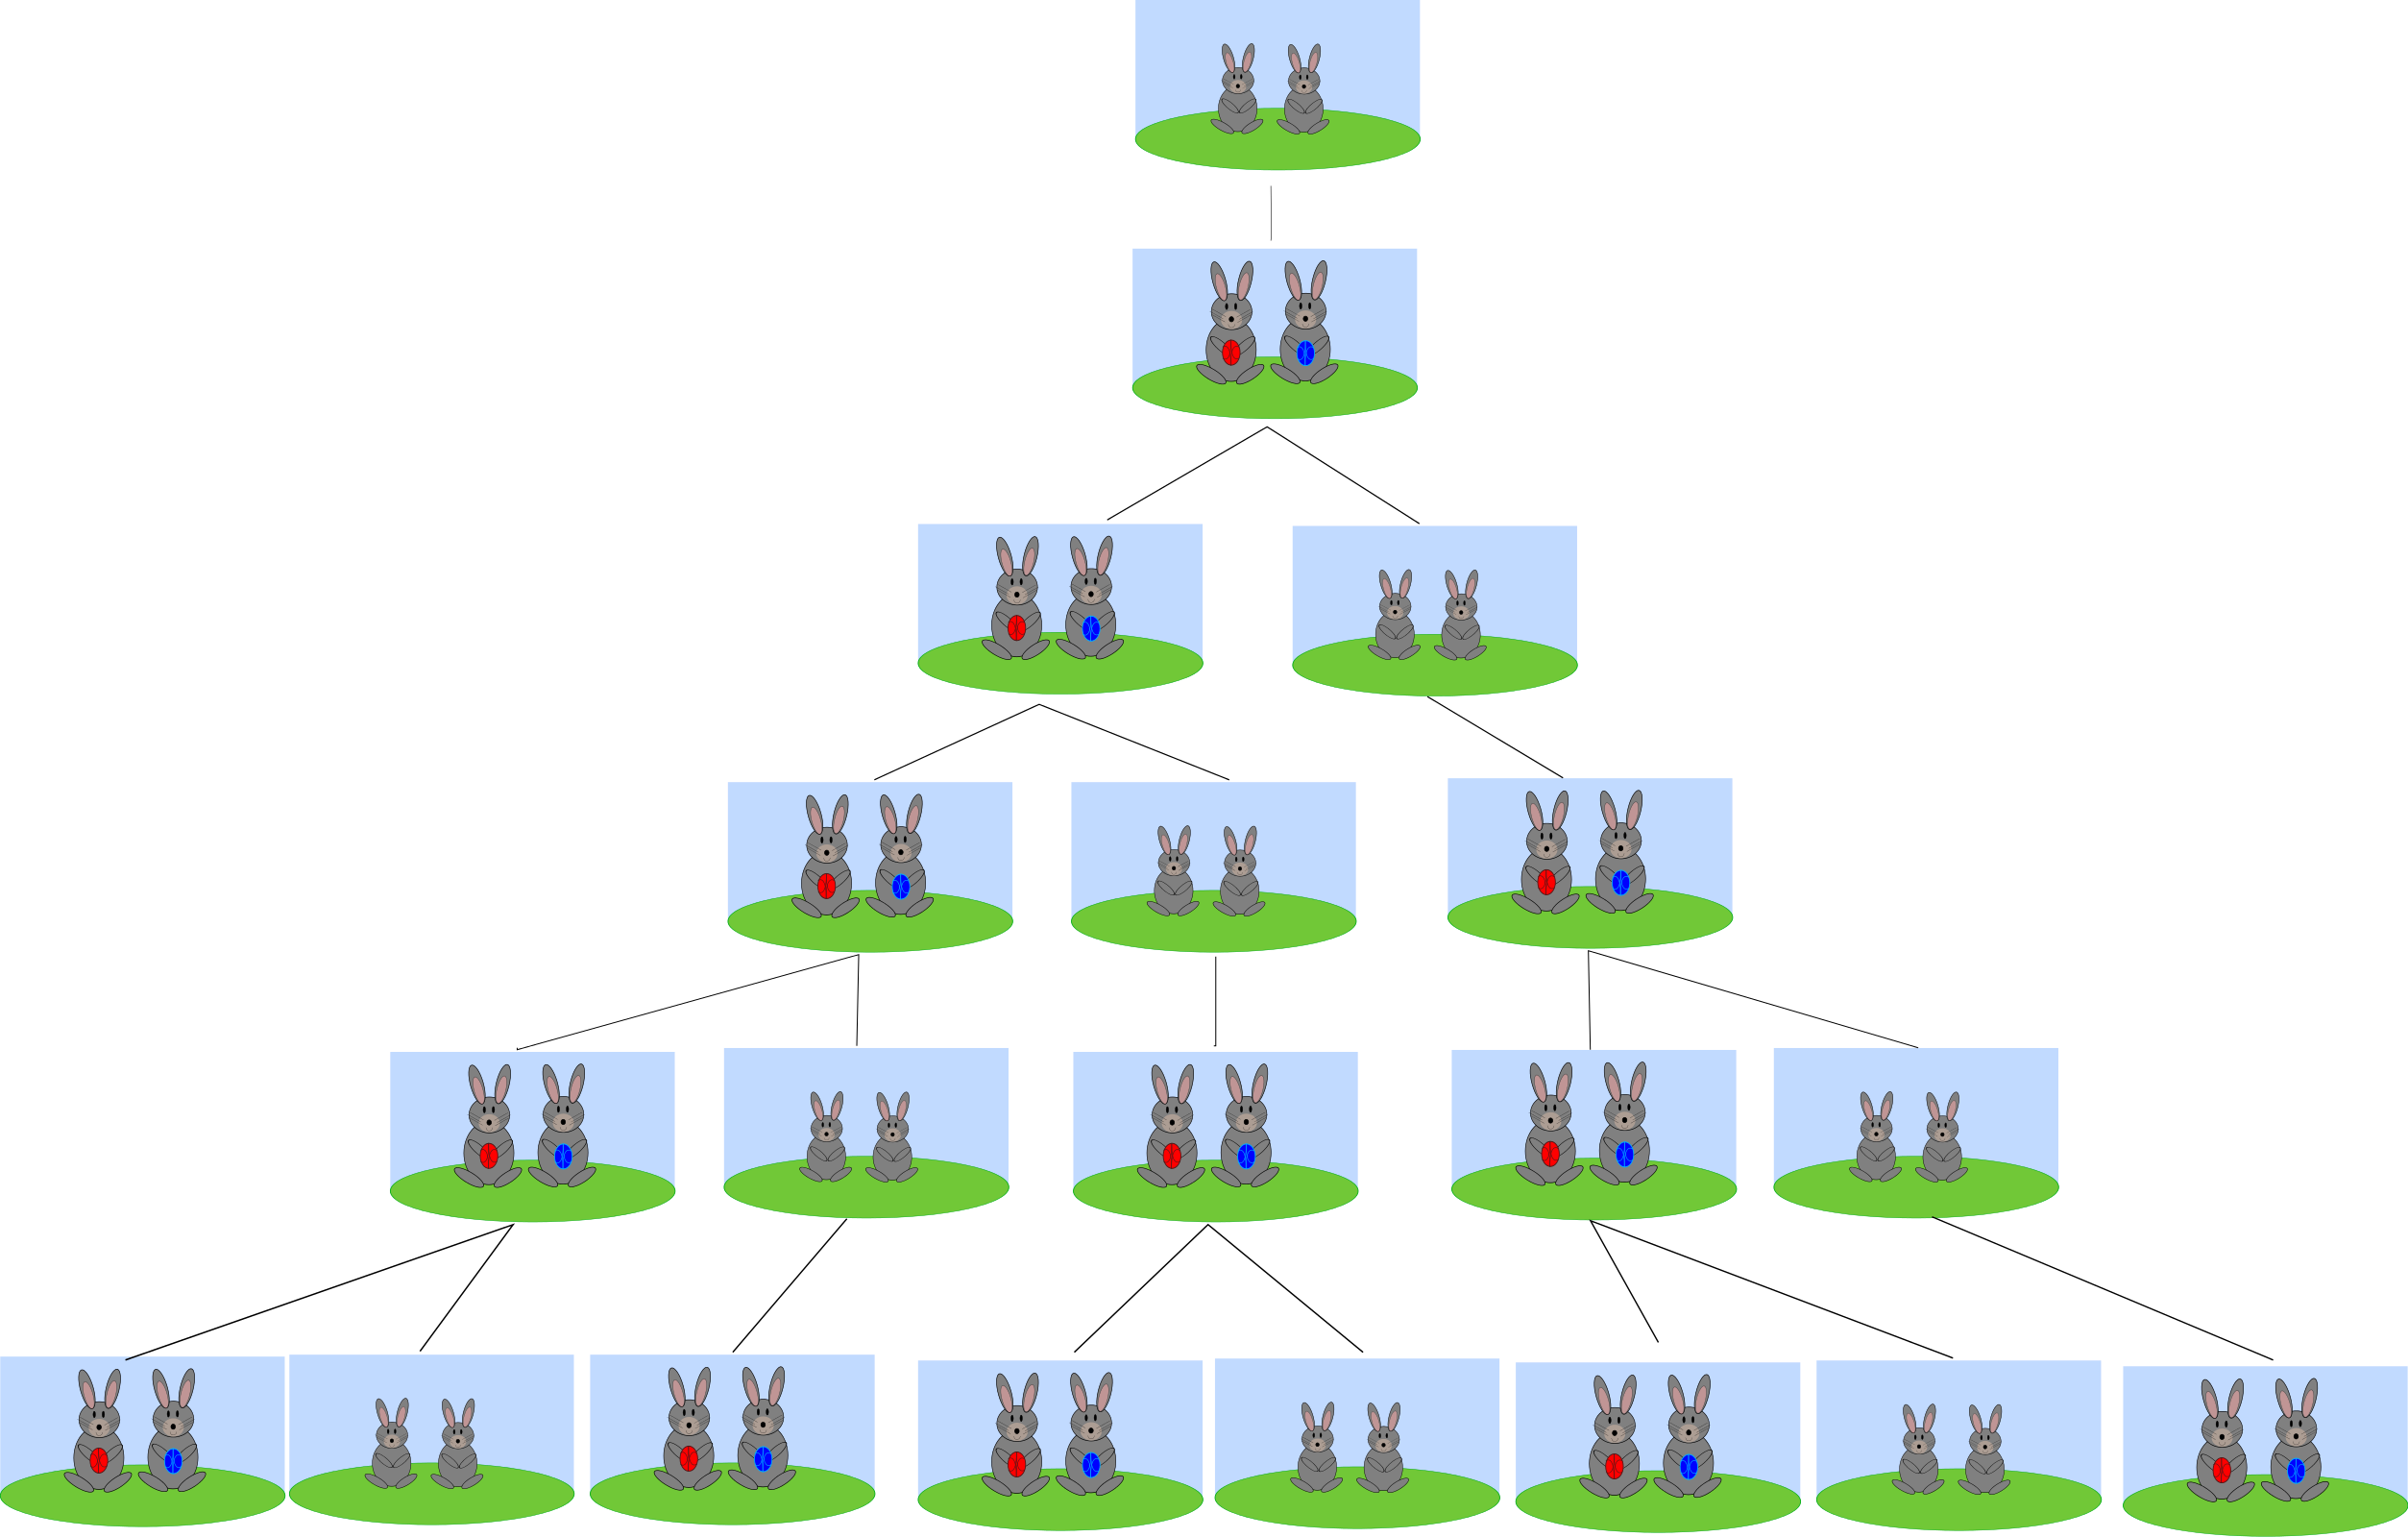
You must have heard or read somewhere that based on idealized assumptions a problem involving the growth of a population of rabbits was solved.
A sequence of numbers was noticed generation after generation, which later was named as Fibonacci numbers.
To know more about Fibonacci numbers you have the full authority to search Google.
Let’s do some mathematics. After all, you and I are traders. Right?
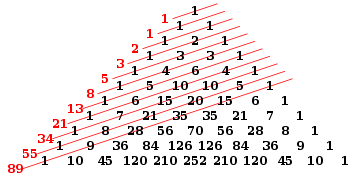
In mathematics, these numbers are the numbers in the following integer sequence known as a Fibonacci sequence.
The interesting fact in this sequence is that each number is the sum of the previous two numbers 1, 1, 2, 3, 5, 8, 13, 21, 34, 55, 89, 144, 233, 377, 610, 987, 1597, 2584, 4181, 6765, …
Often it is modified by adding another digit i.e. “0” at the beginning of this sequence.
I am keeping it simple.
Peace. Though I have mentioned above about Liber Abaci but to be more precise I want to mention that this sequence had been described earlier in Indian mathematics as Virahanka numbers.
These numbers are intimately connected with the golden ratio. I will explain it later.
Also Read: Why Fibonacci Series is important for Technical Analysis?
Origin
According to Wikipedia “The Fibonacci sequence appears in Indian mathematics, in connection with Sanskrit prosody.
In the Sanskrit tradition of prosody, there was interest in enumerating all patterns of long (L) syllables that are 2 units of duration, and short (S) syllables that are 1 unit of duration.
Counting the different patterns of L and S of a given duration results in the Fibonacci numbers: the number of patterns that are m short syllables long is the Fibonacci number Fm + 1.”
Susantha Goonatilake writes that the development of the Fibonacci sequence “is attributed in part to Pingala (200 BC), later being associated with Virahanka (c. 700 AD), Gopāla (c. 1135), and Hemachandra (c. 1150)”.
Parmanand Singh cites Pingala’s cryptic formulamisrau cha (“the two are mixed”) and cites scholars who interpret it in context as saying that the cases for m beats (Fm+1) is obtained by adding a [S] to Fm cases and [L] to the Fm−1 cases. He dates Pingala before 450 BC.
However, the clearest exposition of the sequence arises in the work of Virahanka (c. 700 AD), whose own work is lost but is available in a quotation by Gopala (c. 1135).
The name “Fibonacci sequence” was first used by the 19th-century number theorist Edouard Lucas.
Golden ratio
I heard you murmuring the formula.
Yes, it’s very simple.
Any two quantities are said to be in the golden ratio or golden mean or golden section if their ratio is as same as the ratio of their sum to the larger of the two quantities.
Let me simplify that.
The figure below illustrates the geometric relationship.
Suppose a and b are quantifiable, where a>b>0, thus we get
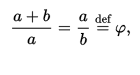
Here the Greek letter phi represents the golden ratio.
Its value is
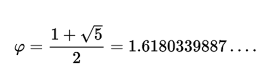
It has many nicknames. This ratio appears in some patterns in nature. Curious to know more? You can read here.
Golden Rectangle
It is a rectangle whose lengths and breadths are in the golden ratio, where phi is approximately 1.618.
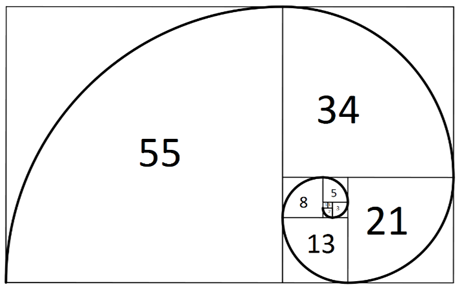
Golden Spiral
It starts with a rectangle for which the ratio between its length and breadth is the golden ratio.
Surprisingly, this rectangle can be partitioned into a square and a similar rectangle and again the process can continue.
After continuing the process for as many times as you like or as you can, the final result will be an almost complete portioning of the rectangle into squares.
Then you can connect the corners of these squares by quarter- circles.
Though it won’t be a perfect logarithmic spiral, but believe me it would approximate a golden spiral.
Fibonacci Ratio in nature
You know Fibonacci numbers are an integral part of nature.
According to some of the best brains on this planet, you can find it in the ether and its fashionable star studded family.
Keeping aside the larger part let’s focus on the third planet of Akash Ganga.
I was stunned to know that from the leaf arrangement in plants to the florets pattern of a flower, a grain of wheat to a single cell of Homo sapiens, these numbers have woven the whole of nature with a definite sequence of numbers. Isn’t it interesting?
Let me share some more facts. Have you seen a sunflower
? If not then go to your neighborhood garden, you will definitely find one.
Do you know that it contains numbers from Fibonacci series? Yes, sometimes 89 or else 144.

Moreover, it has a Golden spiral seed arrangement.
A starfish has five arms, and you must be knowing that it is a Fibonacci number.
I am giving you one more example. You know the shell of the chambered Nautilus has Golden proportions. It is a logarithmic spiral. Fascinating, isn’t it? You can find many more by using Google.
Some Basic concepts in the Fibonacci sequence:
- If you divide a number by the previous number you will get 1.618
Example => 377/233 = 1.618
- A number divided by its following number will give 0.618.It is the basis for the 61.8% retracement. Let me read your mind. You must be thinking of the term “Retracement”. Right? I will explain you later. You go on mugging the basic concepts.
Also Read: A complete overview on trend and theory of retracement
Example => 144/233 = 0.618
- I want to show you few things. Let me write the sequence once more 1, 1, 2, 3, 5, 8, 13, 21, 34, 55, 89, 144, 233, 377, 610, 987, 1597, 2584, 4181, 6765, …
144/233 = 0.618; 89/144 = 0.618; 55/89 = 0.618
144/377 = 0.382
89/377 = 0.236
0.382/0.618 = 0.618
0.236/0.382 = 0.618
377/233 = 1.618
377/144 = 2.618
377/89 = 4.236
1.618/2.618 = 0.618
2.618/4.236 = 0.618
You must have fallen in love with this timeless analysis technique.
Being a trader it’s obvious.
It plays a significant role in determining entry and stop loss levels irrespective of time frames and market conditions.
If you don’t use this tool, please start using it.
We are creatures of emotion, creatures bristling with prejudices and motivated by pride and vanity. There is an old saying on Wall Street that the market is driven by just two emotions which are greed and fear.
Also Read: Mastering Trading Psychology and Money Management to Trade Effectively
Hence, without judging the proper price levels traders and investors enter the market, that also without proper protection, i.e. stop loss levels.
A silly mistake can ruin the outcome which could have been profitable if and only if, he or she has a proper target guided by accurate price levels.
If you are thinking that from your next trade you will use this simple tool, I appreciate your thought process. It is on the right track.
In a layman’s term, it can be used to identify or confirm the crucial demand and supply levels i.e. the support and resistance levels respectively.
Moreover, it also helps to identify price targets.
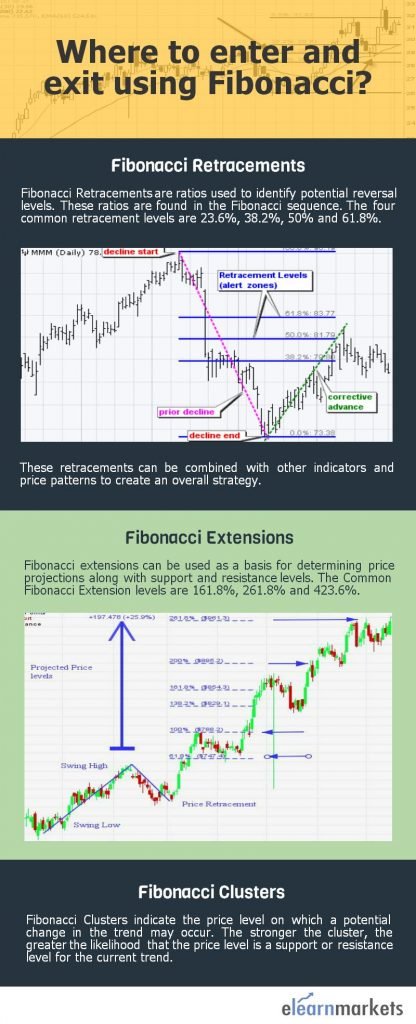
Fibonacci Retracement
As you have already become familiar with Fibonacci, now let’s concentrate on Fibonacci Retracement.
It is specifically used for determining the support and resistance levels.
It is based on the idea that markets will retrace a predictable portion of a move.
After that it will continue to move in it’s original direction.
According to Wikipedia “Fibonacci retracement is created by taking two extreme points on a chart and dividing the vertical distance by the key Fibonacci ratios.
0.0% is considered to be the start of the retracement, while 100.0% is a complete reversal to the original part of the move.
Once these levels are identified, horizontal lines are drawn and used to identify possible support and resistance levels”.
It is very simple to draw.
Just draw a trend line between the high and low and then after dividing the vertical distance by the key Fibonacci ratios of 23.6%, 38.2%, 50%, 61.8% and 100%.
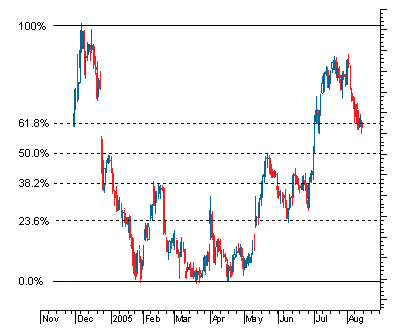
Source : Investopedia
Fibonacci Extensions
These are very simple.
According to investopedia “It is used in Fibonacci retracement to predict spaces of resistance and support in the market. These extensions involve all levels drawn past the basic 100% level.
It is frequently used by traders to determine the so called space that will bring in profits”.
Extension levels are mainly 61.8%, 100%, 138.2%, 161.8%, 200%, 238.2%, 261.8%.
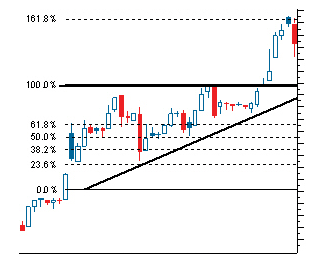
Source : Investopedia
If you want to know more about the role of Fibonacci series in the Financial markets you can watch the video below:
A short video on Fibonacci and Financial Markets
Please remember the following two points
- Fibonacci in upswing
Draw the Fibonacci opposite the swing direction.
So, in an upswing draw it from the last top to the last bottom (always from left to right).
Then you mark the 161.8%, 261.8% and 423.6% if the levels are above the high, whereas if below, then you are free to ignore them.
- Fibonacci in downswing
Draw the Fibonacci opposite the swing direction.
So, in a downswing draw it from the last bottom to the last top (always from left to right).
Then you mark the 161.8%, 261.8% and 423.6% if the levels are below the low, whereas if above, then you are free to ignore them.
If you want to learn technical analysis from scratch, you can enroll in NSE Academy Certified Technical Analysis course on Elearnmarkets.com.
Bottomline
Believe me a lot could be added.
But it is beyond the scope of this article.
There is a common maxim “Champions keep playing until they get it right”.
Hence, like sharpening the axe, use this tool to the utmost to sharpen your trade and maximize the profit.
It is always good “To plan your trade at first, and then trade your plan”.
I am closing this article here.
Thank you for going through this blog.
Be free to leave your suggestions or comments or questions in the space below.


Hello! I just want to offer you a huge thumbs up for the excellent information you’ve got here
on this post. I am returning to your site for more soon.