Relative Strength Index (RSI) is a momentum oscillator, developed by J. Welles Wilder, which measures the speed and velocity of price movement of trading instruments (stocks, commodity futures, bonds, forex, etc.) over a specified period of time.
The objective of the RSI indicator is to measure the change in price momentum. It is a leading indicator and is widely used by Technical Analysts all over the globe. RSI can be used to spot a general trend.
It is considered overbought when it goes above 70 and oversold when it goes below 30. Moreover, the Relative Strength Index can also be used to look for failure swings, divergences, and centerline crossover and to trade effectively using the RSI range shift
How is the Relative Strength Index Calculated?
The formula for calculating the Relative Strength Index is as follows
RSI = 100 – 100 / (1 + RS)
Relative Strength Index= Average Gain over specified period/ Average loss over the same period
The default setting for the Relative Strength Index is 14, but you may change this value to decrease or increase sensitivity based on your requirement.
For instance, a 12-day RSI is more likely to reach overbought or oversold levels than a 24-day RSI.
What is Relative Strength Index Range Shift?
Another very important discussion in the Relative Strength Index is “Range Shift” which states whether the market is in bullish or bearish mode.
When the stock is in a bullish phase, it oscillates in the range of 40 to 80. On the other hand, when a stock is in a bear phase it oscillates in the range of 20 to 60.
It is seen that whenever there is a change in trend, the Relative Strength Index will undergo a “range shift”.
How to Trade with Relative Strength Index?
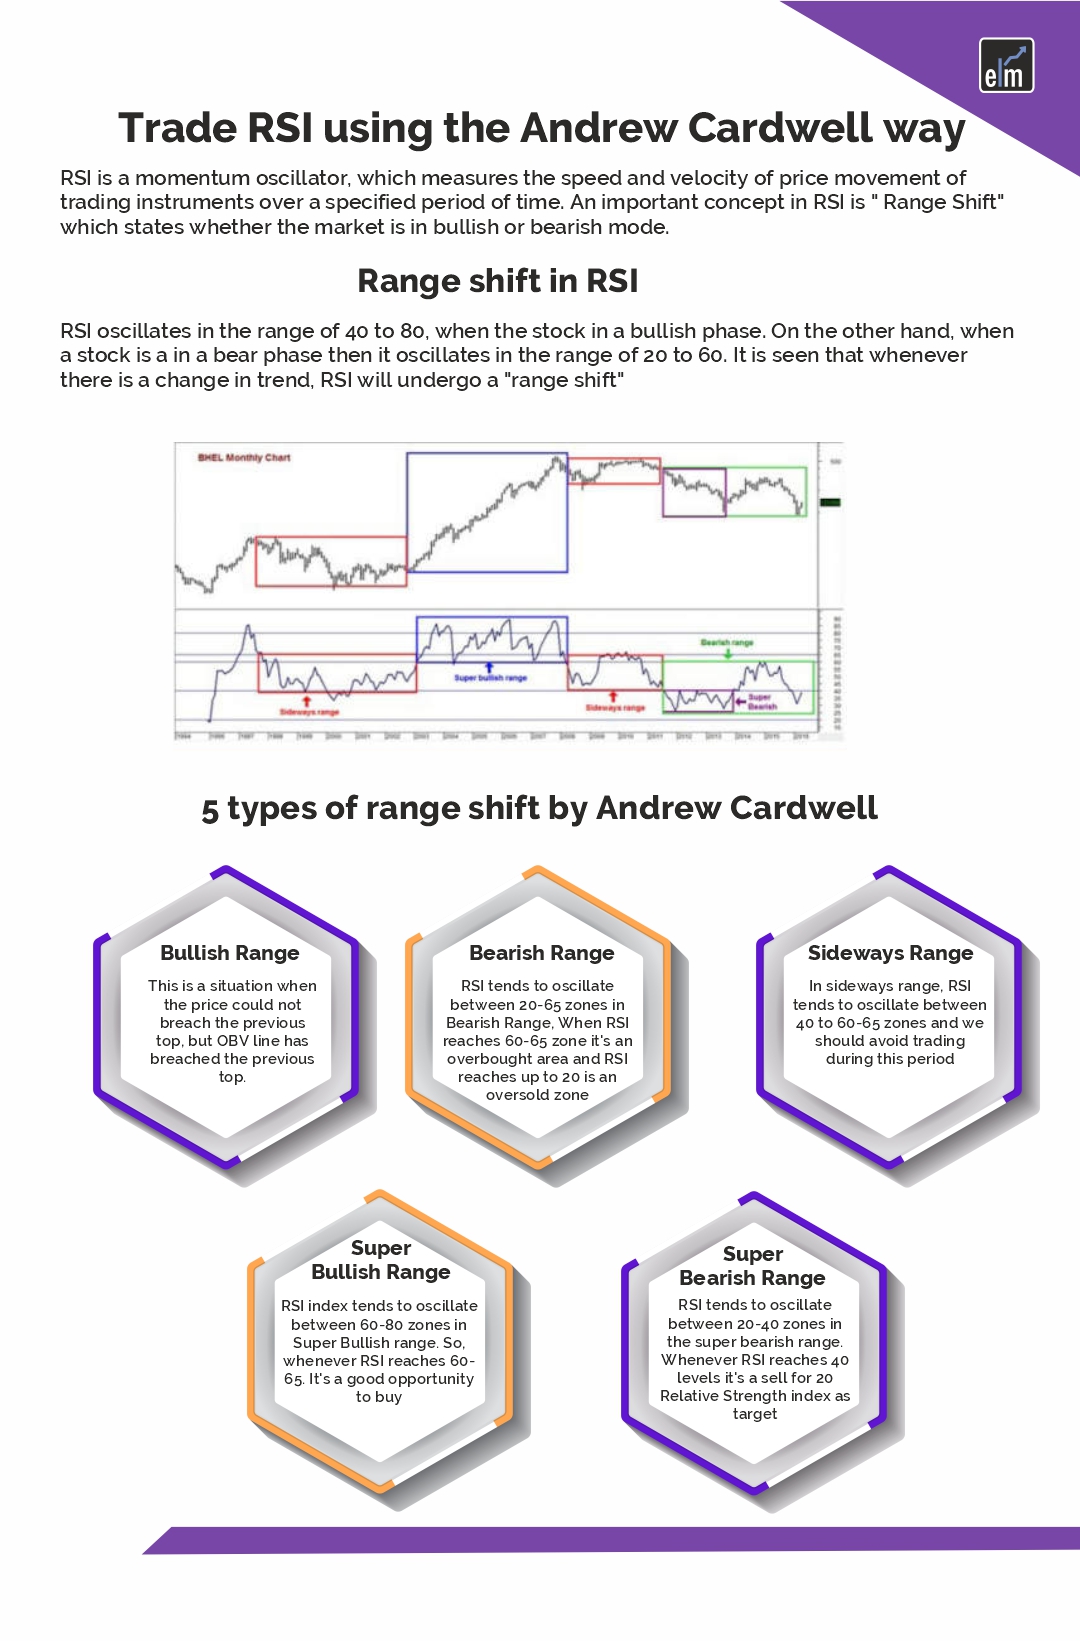
Types of RSI range propounded by Andrew Cardwell
The following are 5 types of Relative Strength Index range shifts that help to determine the trend of the underlying asset.
1) Bullish Range– It has been observed that in the Bullish Range, the Relative Strength Index tends to oscillate in the 40-80 range. When RSI reaches 40, it’s an oversold zone and whenever RSI reaches 80, it’s an overbought zone.
2) Super Bullish Range– It has been seen in the Super Bullish range, the Relative Strength Index tends to oscillate between 60-80 zones. So, whenever RSI reaches 60-65, it’s a good opportunity to buy and it’s very likely the market may bounce back from these levels.
3) Bearish Range– It has been observed that in Bearish Range Relative Strength Index tends to oscillate between 20-65 zones.
Accordingly, when Relative Strength Index reaches the 60-65 zone it’s an overbought area (acts as a good selling point for targets of 40 and 20 on RSI) and RSI reaches up to 20 is an oversold zone and this could be used to enter into a long position for a pullback.

4) Super Bearish Range– It has been observed that the Relative Strength Index tends to oscillate between 20-40 zones in the super bearish range
Whenever RSI reaches 40 levels it’s a sell for 20 Relative Strength Index as a target.
5) Sideways Range– In the sideways range, it has been observed that the Relative Strength Index tends to oscillate between 40 to 60-65 zones which basically helps us to determine that an asset or market is sideways.
Hence, we should avoid trading when the Relative Strength Index is under the sideways range.
Based on the above-discussed Relative Strength Index or RSI range parameters, one can easily trade the underlying asset.
This logic goes well with all types of charts whether it is Index, Stocks, Commodities, Currencies, etc.
Moreover, in the above range shift scenarios, we have taken an additional range of 5 points i.e. 60-65 and this is since some stock works with a level of 65 as resistance and others work with 60 levels as resistance. Hence, a 5 point cushion in the RSI range is taken.
Now we will apply this range shift phenomenon in the charts and see its utility in order to maximize the gains and to book our position. Let’s take examples to discuss the range shift phenomenon in detail.
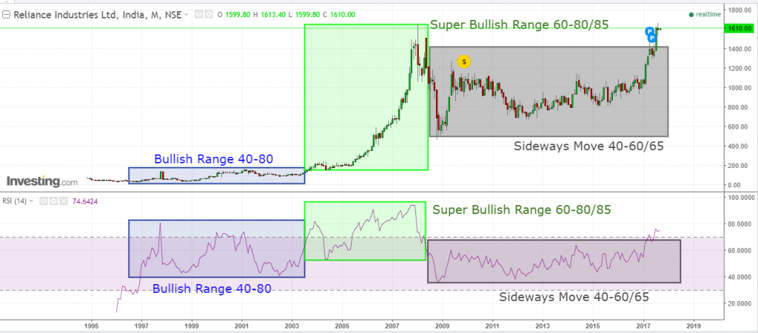
The above is the monthly chart of Reliance Industries where we will understand the Bullish range, Super bullish range, and Sideways range.
The bullish range is defined with the help of a blue box where RSI tends to oscillate between the range of 40-80, where 80 is an overbought condition and 40 is the oversold condition.
As seen in the chart, whenever RSI touched 80 zones, the price tends to slow its momentum and turns down.
The next green box in the chart indicates a super bullish range under which RSI tends to oscillate between the range of 60-80.
It is clearly evident that the stock is getting ready for the strong-up move.
However, the sideways market is shown with the help of a red box where the RSI tends to oscillate between 40 to 60-65 zones.
Here the stock price is expected to move sideways and the trader can witness a lot of whipsaws.
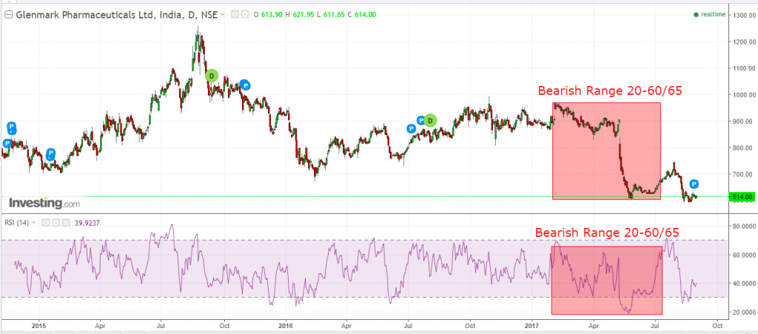
The above chart indicates a bearish range which is highlighted with the help of a red box.
Here Relative Strength Index tends to oscillate between the range of 60-65 to 20 zones where 60-65 is an overbought condition and 20 is the oversold condition.
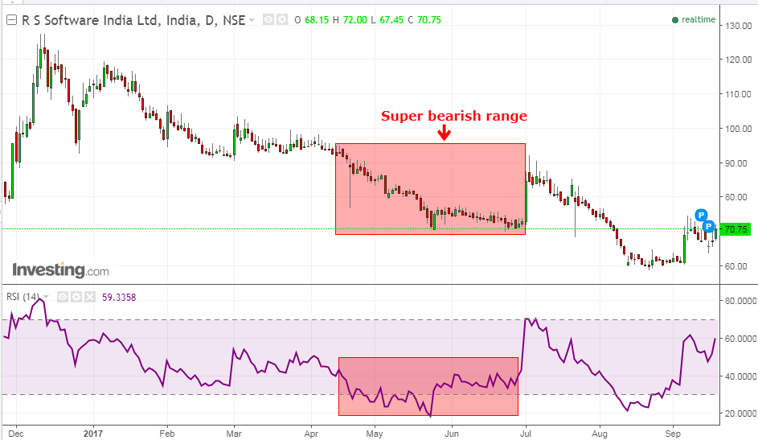
Lastly, the above chart indicates a super bearish range where the RSI tends to oscillate between the 40-20 range and it suggests the strong down move is very likely in the coming days.
Ready to elevate your forex trading skills? Enroll in our Forex Trading Course and master RSI Range Shift strategies today!
Bottomline
The relative+++ Strength Index is a versatile indicator using which we may find overbought-oversold levels, positive and negative divergences, failure swings, etc. In general, RSI overbought conditions are ripe for a reversal, but overbought can also be a sign of strength and vice-versa.
So it’s not that you should stick to the theory taught, rather you may change it according to your need, to suit your trading style. However, just like other indicators, the signal quality will also depend upon the characteristics of the underlying security.
RSI should also be used in conjunction with other indicators and technical parameters to generate better and more confirmed trading signals.


I am very happy to learn. Thank you sir
Hi,
Thank you for Reading!
Keep Reading!
Awesome
it is a good secret of rsi and also more
Hi,
We really appreciated that you liked our blog!
Thank you for Reading!
Keep Reading!
I would like to learn on theories on RSI
Hi,
You can learn about RSI through our course- https://www.elearnmarkets.com/courses/display/rsi-made-easy