Elearnmarkets - Financial Market Learning
  • Courses
  • Webinars
  • Stories
  • Language
    • English
    • Hindi
    • Bengali
No Result
View All Result
Get Free Course
  • Basic Finance
  • Derivatives
    • Futures
    • Options
  • Financial Planning
  • Fundamental Analysis
  • Technical Analysis
  • Mutual Funds
  • Marketshala
  • Miscellaneous
Elearnmarkets - Learn Stock Market, trading, investing for Free
  • Courses
  • Webinars
  • Stories
  • Language
    • English
    • Hindi
    • Bengali
No Result
View All Result
Get Free Course
Elearnmarkets - Learn Stock Market, trading, investing for Free
No Result
View All Result
Home Fundamental Analysis
Earning Per Share - Formula, Factors, & Importance 1

Earning Per Share – Formula, Factors, & Importance

Elearnmarkets by Elearnmarkets
January 9, 2025
in Fundamental Analysis
Reading Time: 9 mins read
0
22.7k
VIEWS
Share on FacebookShare on XShare on WhatsApp
Table of Contents
What is Earning Per Share (EPS)
Why Earnings Per Share is Important?
What is Earning Per Share Growth?
Formula
Factors Affecting Earning Per Share
Impact

There are a lot of ratios that help the investor to make any investment decision; one such ratio is the earning per share which depicts the efficiency of a company in generating profits from its business venture.

What is Earning Per Share (EPS)?

EPS measures the amount of net income earned per share of stock outstanding. In other words, this is the amount of money each share of stock would receive if all of the profits were distributed to the outstanding shareholders at the end of the year. 

A large company’s profits per share cannot be compared to a small company’s profits per share. A larger company will have to split its earnings amongst many more shares of stockholders compared to a smaller company.

Earning Per Share - Formula, Factors, & Importance 2

Why Earnings Per Share is Important?

EPS is very important for all the investors as it indicates that how much income is being earned by each ordinary shareholder. It gives an understanding of the profitability of the company.

Investors use earnings per share to compare with the share price of the shares to determine the value of earning and how shareholders feel about the future growth of the company.

In order to determine the value of earning from the share, shareholders also calculate EPS in two different ways:

  • Basic Earnings Per Share
  • Diluted Earnings Per Share
  • Cash earnings per share

1. Basic EPS

Basic EPS does not take into account any dilutive effect that convertible securities have on its EPS.

For example, it does not take into account any right issue or bonus issue. i.e the company offers extra shares to its shareholders.

2. Diluted EPS

Basic earnings per share take into account only those shares in an issue that were outstanding during the period.

Sometimes in the future company may have entered into obligations that could have diluted the EPS in the future.

Learn from Market Experts – Macroeconomics made Easy

So, basic earnings per share should be adjusted for the effect of all the dilutive potential ordinary shares.

3. Cash EPS

Cash EPS or more commonly operating cash flow per share measures the financial performance of the company.

Free from non-cash items like depreciation which is included in basic EPS calculation, cash EPS may prove to be a more reliable measure of the financial and operational health of the company. The higher the company’s cash EPS, the better it is considered to have performed over a period.

What is Earning Per Share Growth?

Growth in earning per share indicates that by what percentage the earning per share has been increasing in comparison to the previous 12 months.

A higher ratio indicates that the company’s profitability has increased and it is running its business efficiently.

On the other hand lower ratio indicates that the company’s profit has reduced and is not utilizing the funds efficiently.
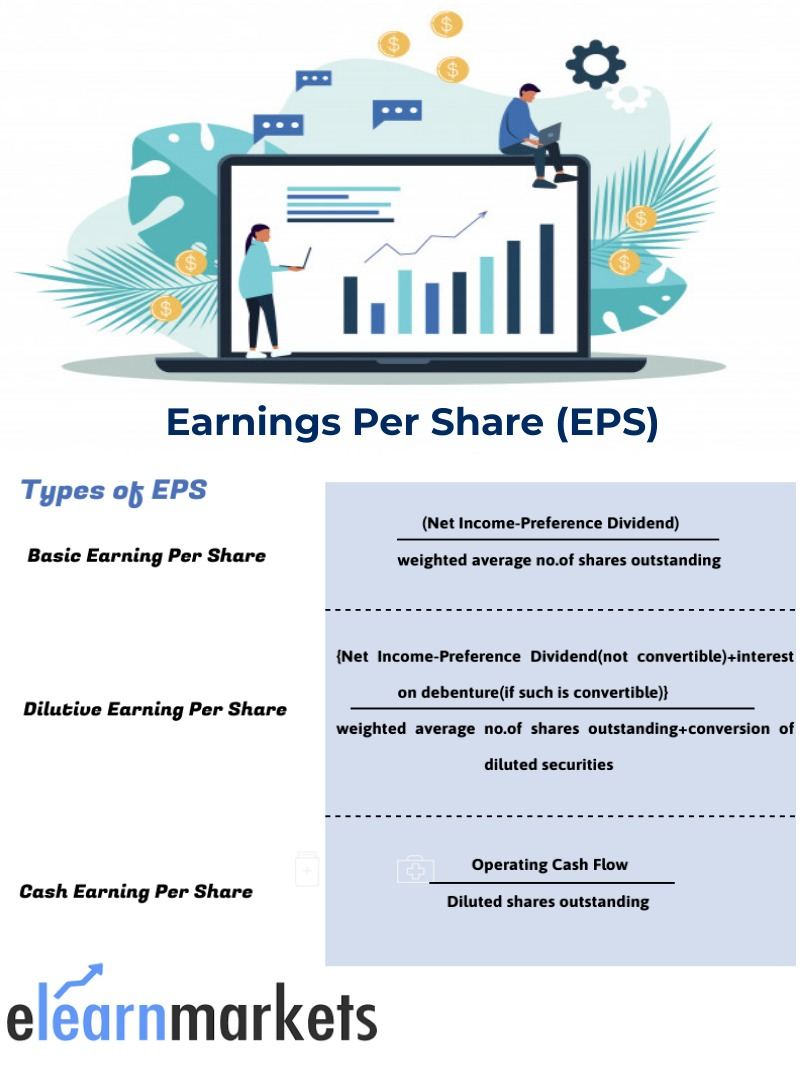
Formula:

Earnings per share or basic earnings per share is calculated as net income after subtracting preferred dividend divided by the weighted average number of common shares outstanding.

Basic Earning Per Share – (Net income – Preference dividend) / Weighted average no of share outstanding

Diluted Earning Per Share–  {Net income – preference dividend (which are not convertible) + Interest on debenture (if such debenture is convertible)} / (Weighted average no of share outstanding + conversion of diluted securities)

Cash Earning Per Share–  (Operating cash flow / Diluted shares outstanding)

Factors Affecting Earning Per Share:

Earning per share gets affected by various factors.

  • When earnings of the company increases this affects the EPS positively as it also increases.
  • Earnings per share increases when the total number of outstanding share decreases in case of buyback.
  • When expenses decreases and company is able to cut the cost then also the earnings of the company increases with increase in sales.
  • Earnings per share decreases when company issues new shares which affect the earnings per share negatively for example in case of rights and bonus.

Let us understand this with a particular example.

Company: – Indiamart Intermesh Ltd.

FY19 FY20
NET PROFIT AFTER TAX (in crores)    20149
NO. OF SHARES OUTSTANDING(in crores) 2892.89   2.892.89
EARNING PER SHARE  7.03  51
GROWTH ON EARNING PER SHARE =   ((51-7.03)/7.03)*100
= 625 %

As on March’20 net profit has increased from Rs. 20 crore to Rs.149 crore thus the EPS also saw a whopping growth. Overall company’s profitability increased and also its growth which gives a positive view to its shareholders.

Impact

Since investors keep an eye on the share price of all the listed companies increasing EPS attracts investors as they like to invest in companies whose earnings are on a constant rise.

This shows that the company is utilizing the funds of the shareholders efficiently and providing them with a good return.

Negative or lower earnings per share do not attract investors and give a poor indication about the future of the company.

Let us understand this with an example.

Company: – Bharti Airtel

FY19 FY20
NET PROFIT AFTER TAX (in crores)   409.5 -32183.2
NO. OF SHARES OUTSTANDING (in crores)545.56  545.56
EARNING PER SHARE     0.94   -58.99   
GROWTH ON EARNING PER SHARE  
=   ((-58.99-0.94)/0.94)*100
=     -6375%

This reduces the interest of the shareholders as it indicates that the company is not running the business and utilizing the funds efficiently.

It is not giving a good picture of the company for the future growth potential.

Thus it does not attract the investor community.  

Thus this is how EPS forms a very important metric for investment destination.   

Key Takeaways:

  • Earnings per share indicate how much money a company makes for each of its shareholders.
  • EPS Growth is the percentage change in earning per share of the current year from the earnings per share of previous year.
  • A higher or increasing earnings per share indicates that the company is earning more profits to distribute to its shareholders.
  • Higher or increasing growth on EPS gives a good indication about the company’s efficiency on its business prospects.
  • Lower or decreasing EPS gives poor indication about the health of the company and gives lower return to the shareholders.
  • Lower or decreasing growth on EPS gives poor indication about the company’s future growth prospect.

Happy Learning!

In order to get the latest updates on Financial markets visit StockEdge.com

Tags: earning per shareenglisheps formulaintermediate
ShareTweetSend
Get Kotak Offer Get Kotak Offer Get Kotak Offer
Previous Post

पुट ऑप्शन – पुट ऑप्शन की खरीद, बिक्री, फॉर्मूला और ट्रेडिंग

Next Post

Problems in Technical Analysis and How to Overcome Them

Elearnmarkets

Elearnmarkets

Elearnmarkets (ELM) is a complete financial market portal where the market experts have taken the onus to spread financial education. ELM constantly experiments with new education methodologies and technologies to make financial education effective, affordable and accessible to all. You can connect with us on Twitter @elearnmarkets.

Related Posts

Top 5 Valuation Ratios in the Stock Market 3
Fundamental Analysis

Top 5 Valuation Ratios in the Stock Market

May 5, 2025
837
price to sales ratio
Fundamental Analysis

Price to Sales Ratio: A Key Metric for Understanding Company Value

May 5, 2025
450
Gearing Ratio
Fundamental Analysis

What Is the Gearing Ratio? Formula & Calculation

December 3, 2024
1.2k
Top 5 Fundamental Analysis Tools 4
Fundamental Analysis

Top 5 Fundamental Analysis Tools

January 31, 2025
4.1k

Leave a Reply Cancel reply

Your email address will not be published. Required fields are marked *

Disclaimer

Elearnmarkets (Kredent InfoEdge Pvt. Ltd.) is a SEBI-registered Research Analyst (RA) entity (SEBI Registration No.: INH300007493). The information provided in this article is for educational and informational purposes only and should not be considered as an offer to buy or sell any securities or investment products.

The stocks, securities, and investment instruments mentioned herein are not recommendations under SEBI (Research Analysts) Regulations, 2014. Readers are advised to conduct their own due diligence and seek independent financial advice before making any investment decisions.

Investments in securities markets are subject to market risks. Please read all related documents carefully before investing. Investing in Equity Shares,
Derivatives, Mutual Funds, or other instruments carry inherent risks, including potential loss of capital. Elearnmarkets (Kredent InfoEdge Pvt. Ltd.) does not provide any guarantee or assurance of returns on any investments. Past performance is not indicative of future performance.

Elearnmarkets Logo

Follow Us

Facebook-f X-twitter Instagram Linkedin-in Youtube Telegram

Register on Elearnmarkets

Continue your financial learning by creating your own account on Elearnmarkets.com

Register Free Account

Download App

Playstore logo
Download on app store

Categories

  • Basic Finance
  • Derivatives
  • Financial Planning
  • Fundamental Analysis
  • Technical Analysis
  • Mutual Funds
  • Miscellaneous

Popular On Elearnmarkets

  • Market Superheroes:
  • Vivek Bajaj
  • Chetan Panchamia
  • Ashish Kyal
  • Premal Parekh
  • Abhijit Paul
  • Jegan
  • Sivakumar Jayachadran
  • Jyoti Budhia
  • Vivek Gadodia
  • Vishal Mehta
  • Piyush Chaudhry
  • Santosh Pasi
  • Gomathi Shankar
  • Market Superheroes:
  • Vivek Bajaj
  • Chetan Panchamia
  • Ashish Kyal
  • Premal Parekh
  • Abhijit Paul
  • Jegan
  • Sivakumar Jayachadran
  • Jyoti Budhia
  • Vivek Gadodia
  • Vishal Mehta
  • Piyush Chaudhry
  • Santosh Pasi
  • Gomathi Shankar
  • Courses:​
  • Options Trading
  • Dow Theory
  • Momentum Trading
  • Stock Investing
  • Harmonic Chart Patterns
  • Algo Trading
  • Elliot Wave Theory
  • Advanced Excel
  • Cryptocurrency
  • NSE Certification Course
  • Courses:​
  • Options Trading
  • Dow Theory
  • Momentum Trading
  • Stock Investing
  • Harmonic Chart Patterns
  • Algo Trading
  • Elliot Wave Theory
  • Advanced Excel
  • Cryptocurrency
  • NSE Certification Course
  • Webinars:
  • Bank Nifty Scalping
  • Intraday Trading Strategies
  • Options Trading Strategies
  • Options selling
  • Price Action
  • Relative Strength
  • Tax Planning
  • Options Buying
  • Growth Stocks
  • Portfolio Management
  • Risk Management
  • Renko Charts
  • Crude Oil
  • Traders Psychology
  • Moving Average
  • Multibagger Stocks
  • Free Learning Modules:
  • Intraday Trading
  • Options Scalping
  • Swing Trading
  • Financial Modelling
  • RSI Indicator
  • Bollinger Bands
  • Pricing of Futures
  • Personal Finance
  • Initial Public Offerings (IPO)
  • Value Investing
  • Technical Indicators
  • Candlesticks
  • Chart Patterns
  • Option Greeks
  • ELSS Funds
  • Banking and Insurance
  • Real Estate
  • Gold
  • Book Summaries:
  • Rich Dad Poor Dad
  • Psychology of Money
  • The Intelligent Investor
  • The Richest Man in Babylon
  • Think and Trade Like a Champion
  • Value Investing and Behavioural Finance
  • Trading in the Zone
  • Learn to Earn
  • Book Summaries:
  • Rich Dad Poor Dad
  • Psychology of Money
  • The Intelligent Investor
  • The Richest Man in Babylon
  • Think and Trade Like a Champion
  • Value Investing and Behavioural Finance
  • Trading in the Zone
  • Learn to Earn
  • Tools:
  • CAGR Calculator
  • SIP Calculator
  • eLearnOptions
  • Future Value Calculator
  • Present Value Calculator
  • Atal Pension Yojana
  • Cost of Delay Calculator
  • Become a Crorepati
  • Tools:
  • CAGR Calculator
  • SIP Calculator
  • eLearnOptions
  • Future Value Calculator
  • Present Value Calculator
  • Atal Pension Yojana
  • Cost of Delay Calculator
  • Become a Crorepati

© 2025 Elearnmarkets. All Rights Reserved

  • Visit Elearnmarkets
  • Courses
  • Webinars
  • Financial Guides
  • Get Free Counselling
  • Visit Elearnmarkets
  • Courses
  • Webinars
  • Financial Guides
  • Get Free Counselling

Download Our App

No Result
View All Result
  • Article Categories
    • Basic Finance
    • Derivatives
    • Financial Planning
    • Fundamental Analysis
    • Technical Analysis
    • ETFs & Mutual Funds
    • Marketshala
    • Miscellaneous
  • Language
    • Hindi
    • Bengali
    • English
  • Courses
  • Webinars
  • Stories
Get Free Course

© 2024 Elearnmarkets All Rights Reserved

Trading Mentorship Program