Key Takeaways
- Bearish Continuation Pattern: The Downside Tasuki Gap signals ongoing selling pressure in a downtrend.
- Three-Candle Formation: It consists of two red candles followed by a small green candle that fails to fill the gap.
- Indicates Weak Buyers: The pattern shows that buyers’ attempts to reverse the trend are unsuccessful.
- Confirmation Needed: Use with other indicators like RSI, moving averages, and volume to validate signals.
- Trading Insight: Recognizing this pattern can help identify short-selling or bearish opportunities in the market.
Candlestick patterns are one of the most useful tools for traders to understand market sentiment.
They help identify who is in control – the bulls or the bears. Among various candlestick formations, the Downside Tasuki Gap is a bearish continuation pattern that signals ongoing selling pressure in the market.
Let’s understand the Downside Tasuki Gap pattern in detail, step by step.
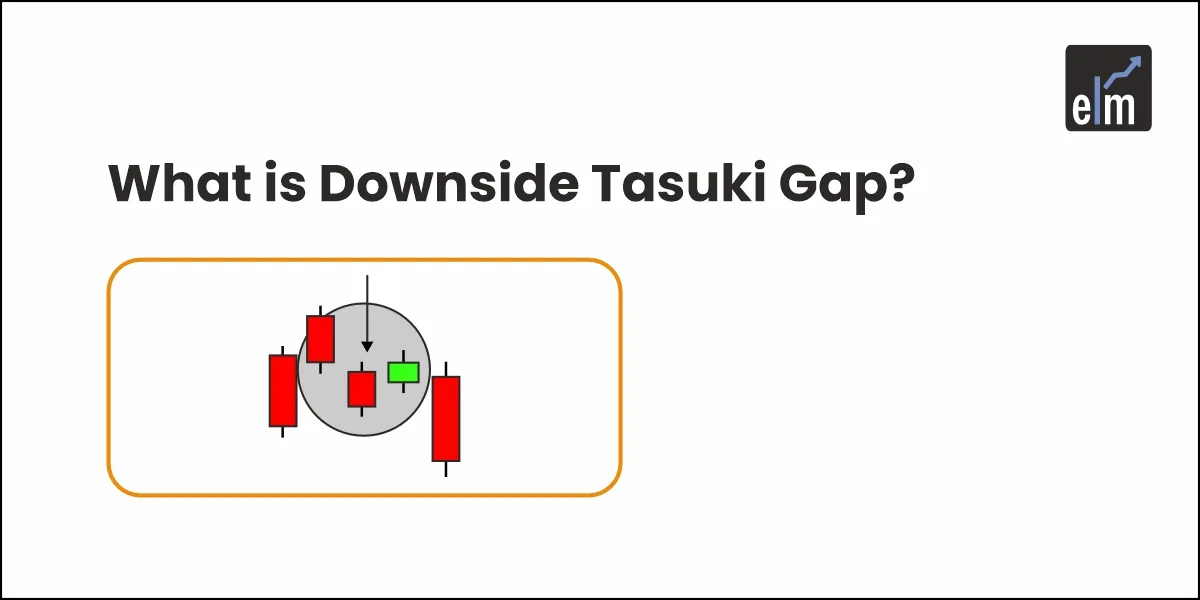
What is the Downside Tasuki Gap?
A Downside Tasuki Gap is a three-candle pattern that appears during a downtrend. It represents a temporary attempt by buyers to reverse the trend, which eventually fails.
In simpler words, Downside Tasuki Gap pattern tells us that the downward momentum is likely to continue after a short break.
It confirms that the bearish sentiment in the market remains strong.
What Does this Gap Tell Us?
The Downside Tasuki Gap is a continuation pattern, not a reversal signal. When it forms, it indicates that after a small upward pullback, sellers are likely to regain control and push the price lower again.
In technical terms, this pattern suggests that the gap created by strong selling pressure is not filled, which means the market still has enough bearish momentum to continue downward.
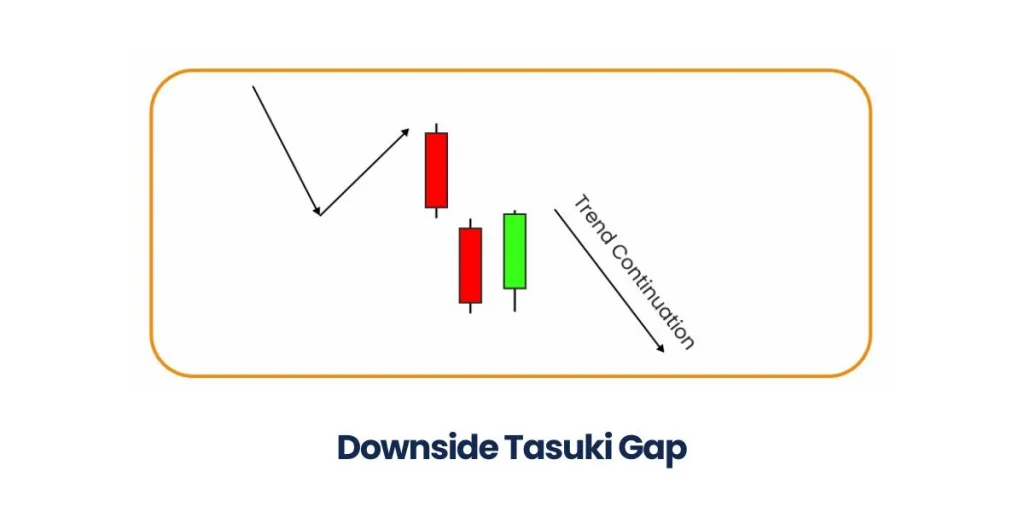
Formation of Downside Tasuki Gap
The Downside Tasuki Gap forms through three distinct candles:
- First Candle:
A large bearish (red) candle appears, showing strong selling pressure. - Second Candle:
The next candle gaps down, opening below the first candle’s close and closing even lower. This gap-down movement confirms continued bearish sentiment. - Third Candle:
A small bullish (green) candle follows, which opens within the body of the second candle and moves slightly upward. However, it fails to fill the gap between the first and second candles. This incomplete gap-filling shows that buyers are weak, and the downtrend is likely to continue.
Once this pattern is complete, traders often expect prices to move lower in the coming sessions.
Downside Tasuki Gap Example:
Let’s take a simple example to understand it better.
Suppose a stock is trading around ₹120 and then falls sharply to ₹110 with a long red candle. The next day, it gaps down and opens at ₹108, closing further lower at ₹102 – forming another red candle.
On the third day, the stock opens at ₹104 and rises slightly to ₹106, forming a small green candle. However, it fails to close the gap between ₹110 and ₹108.
This three-day formation creates a Downside Tasuki Gap. It indicates that even though buyers tried to lift the price, the selling pressure remains strong, and the stock may continue falling.
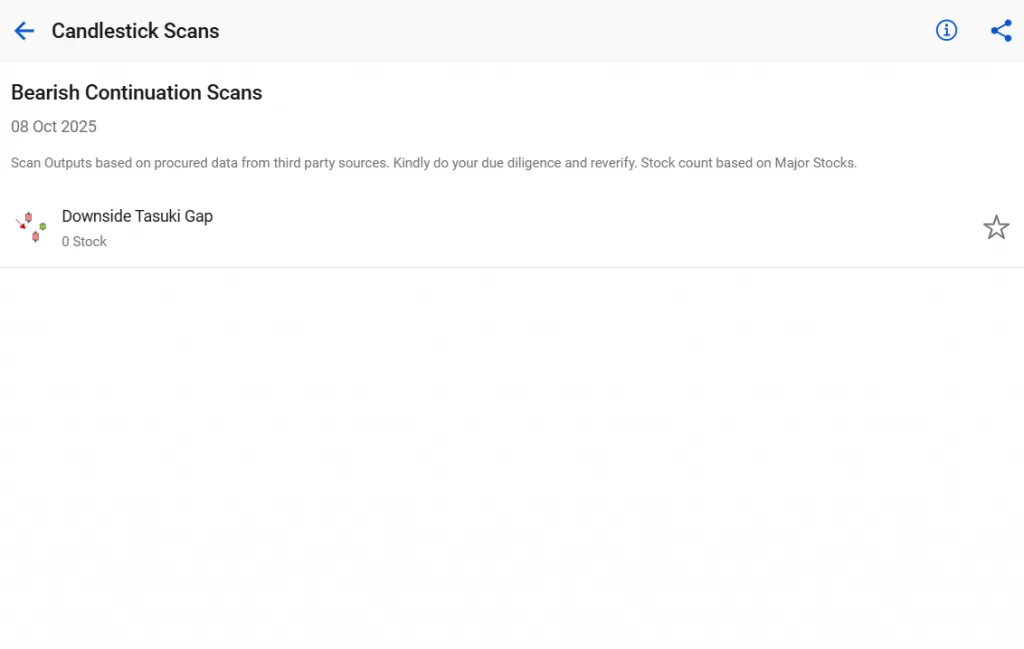
How to Use it in StockEdge
You can easily identify the Downside Tasuki Gap pattern using the StockEdge App under the Candlestick Scans section.

Follow these steps:
- Open the StockEdge App.
- Go to Scans → Candlestick Patterns → Bearish Continuation Patterns.
- Select Downside Tasuki Gap.
- You’ll see a list of stocks where this pattern has appeared.
After identifying the pattern, check the overall trend and confirm it with other indicators such as RSI, Moving Averages, and volume. This increases the reliability of your analysis and reduces false signals.
Conclusion
The Downside Tasuki Gap is a useful bearish continuation pattern that helps traders confirm ongoing weakness in a stock. It typically forms in a downtrend and suggests that a brief upward movement by buyers is not strong enough to reverse the trend.
However, traders should not rely solely on this pattern. It’s best used in combination with other technical tools and indicators for confirmation.
Recognizing Downside Tasuki Gap pattern on time can help traders spot short-selling or bearish opportunities in the market.
For more candlestick patterns, check out our detailed blog on 35 Essential Candlestick Chart Patterns.
Frequently Asked Questions (FAQs)
What does Downside Tasuki Gap mean?
It is a bearish continuation pattern that indicates sellers are still dominant even after a small upward move. The downtrend is likely to continue.
How often does Downside Tasuki Gap appear?
It is not very common but tends to appear during strong downtrends. When it does, it provides a strong confirmation of continued bearish sentiment.
What is Upside Tasuki Gap?
The Upside Tasuki Gap is the bullish counterpart of this pattern. It forms during an uptrend, where a small bearish candle fails to fill the gap between two bullish candles, confirming that the uptrend is likely to continue.
