Key Takeaways:
- Doji forms when the opening and closing prices are nearly the same, creating a cross-like shape
- It reflects a tug-of-war between buyers and sellers with no clear winner
- Often signals indecision or a possible trend reversal, especially after strong moves
- Formation occurs when price moves up and down during the session but closes near the open
- Common types include Standard Doji, Long-Legged Doji, Dragonfly Doji, Gravestone Doji, each giving unique clues based on wick positions
A Doji candle is a candlestick pattern that looks like a cross, as the opening and closing prices are equal or almost the same.
The word Doji is of Japanese origin which means blunder or mistake that refers to the rarity of having the open and close price be exactly the same.
- What is Doji candlestick pattern?
- How is a Doji candlestick Pattern formed?
- What does a Doji tell traders?
- Types of Doji Candlestick Pattern
- Doji Example:
- What is the Difference between a Doji and a Spinning Top?
- How to use Doji Candlestick Scans in StockEdge:
- Limitations of a Doji
- Frequently Asked Questions (FAQs)
What is Doji candlestick pattern?
The Doji candlestick pattern can lead to high profits in trading.
The versatility of this candlestick pattern is appreciated by all types of traders for different time frames.
The Doji candlestick pattern is a formation that occurs when a market’s open price and close price are almost exactly the same.
How is a Doji candlestick Pattern formed?
This doji candlestick is formed when the market opens, and bullish traders push prices up, whereas bearish traders reject the higher price and push it back down.
It could also be that bearish traders try to push prices as low as possible, and the bulls fight back and push the price up.
The upward and downward movements that happen between opening and closing form the wick.
The body is formed when the price closes at almost the same level as it opened.
What does a Doji tell traders?
When looked at in isolation, a Doji candlestick pattern indicates that neither the buyers nor sellers are gaining – it’s a sign of indecision.
Whereas some traders believe that the Doji candlestick pattern indicates an upcoming price reversal when viewed alongside other candlestick patterns, this may not always be the case.
It could indicate that buyers or sellers are gaining momentum for the continuation of the ongoing trend.
It’s important to remember that the Doji candlestick pattern does not provide as much information as one would need to make a decision.
Before acting on any signals, including the Doji candlestick chart pattern, one should always consider other patterns and indicators.
Types of Doji Candlestick Pattern
There are different types of Doji candlestick patterns, namely the Common Doji, Gravestone Doji, Dragonfly Doji and Long-Legged Doji.

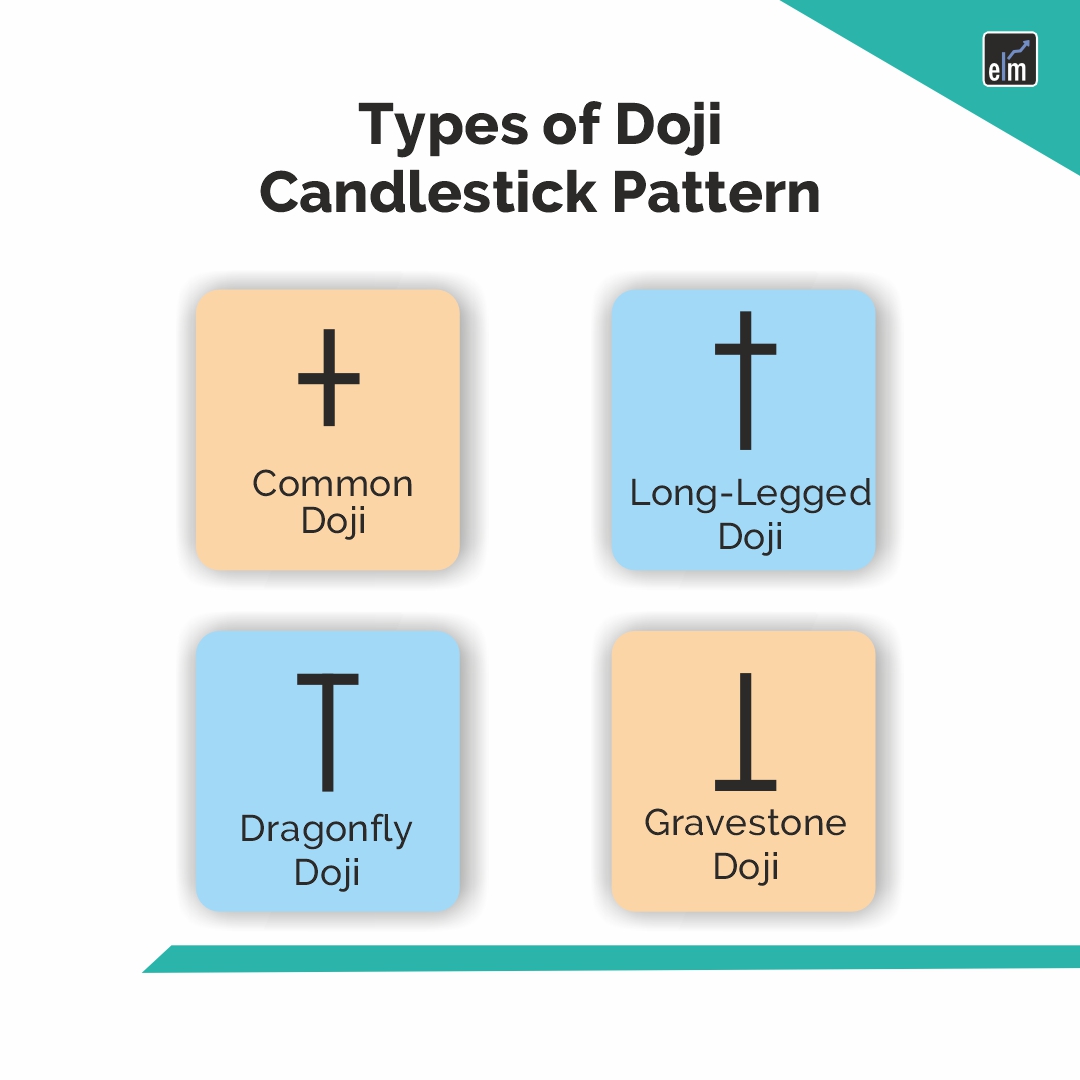
Let us discuss them:
1. Neutral Doji
This is the most common type of Doji candlestick pattern.
When buying and selling are almost the same, this pattern occurs.
The future direction of the trend is uncertain, as indicated by this Doji pattern.
2. Long-Legged Doji
As the name suggests, this is a long-legged candlestick pattern.
When the supply and demand factors are at equilibrium, then this pattern occurs. The trend’s future direction is regulated by the prior trend and Doji pattern.
3. Gravestone Doji
This pattern is found at the end of the uptrend when supply and demand factors are equal.
At the day’s low, the candlestick opens and closes. The prior trend and Doji pattern regulate the future direction of the trend.
4. Dragonfly Doji
This pattern appears at the end of the downtrend when the supply and demand factors are at equilibrium.
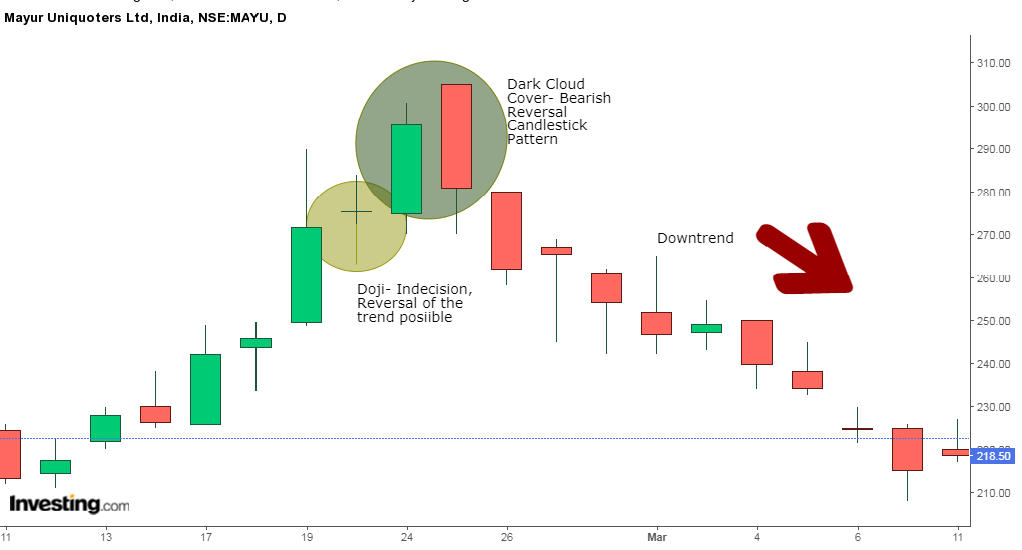
Doji Example:
In the below chart of Mayur Uniquoters Ltd, we can see that at the end of the uptrend, a Doji candle is formed, indicating that the ongoing trend has become certain.
The Doji is then followed by the Dark Cloud Cover candlestick pattern that confirms that the reversal is going to take place, as shown below:
What is the Difference between a Doji and a Spinning Top?
The spinning top is quite similar to the doji candlestick pattern, but its body is larger when compared to the Doji.
A candle’s real body generally represents up to 5% of the size of the entire candle’s range to be a Doji candlestick pattern.
Any more than that, it becomes a spinning top. A spinning top candlestick also signals weakness in the current trend.
If either a Doji or spinning top is spotted, then traders should look to other indicators, such as Bollinger Bands, to determine the context to decide if they indicate trend continuation or reversal.
How to use Doji Candlestick Scans in StockEdge:
You can also use the Doji Candlestick pattern scans in the StockEdge web version:
Steps to use Doji Candlestick scans in StockEdge:
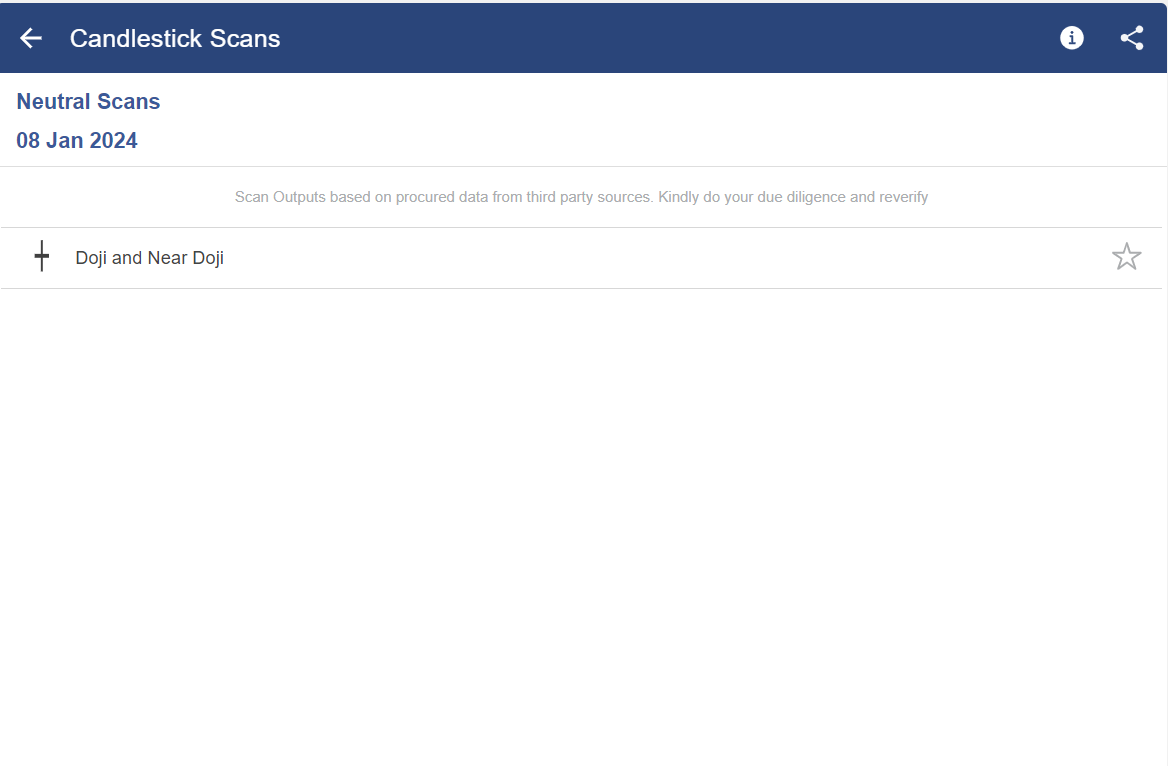
Under the “Candlestick Scans” we can see Neutral Scans as shown below:
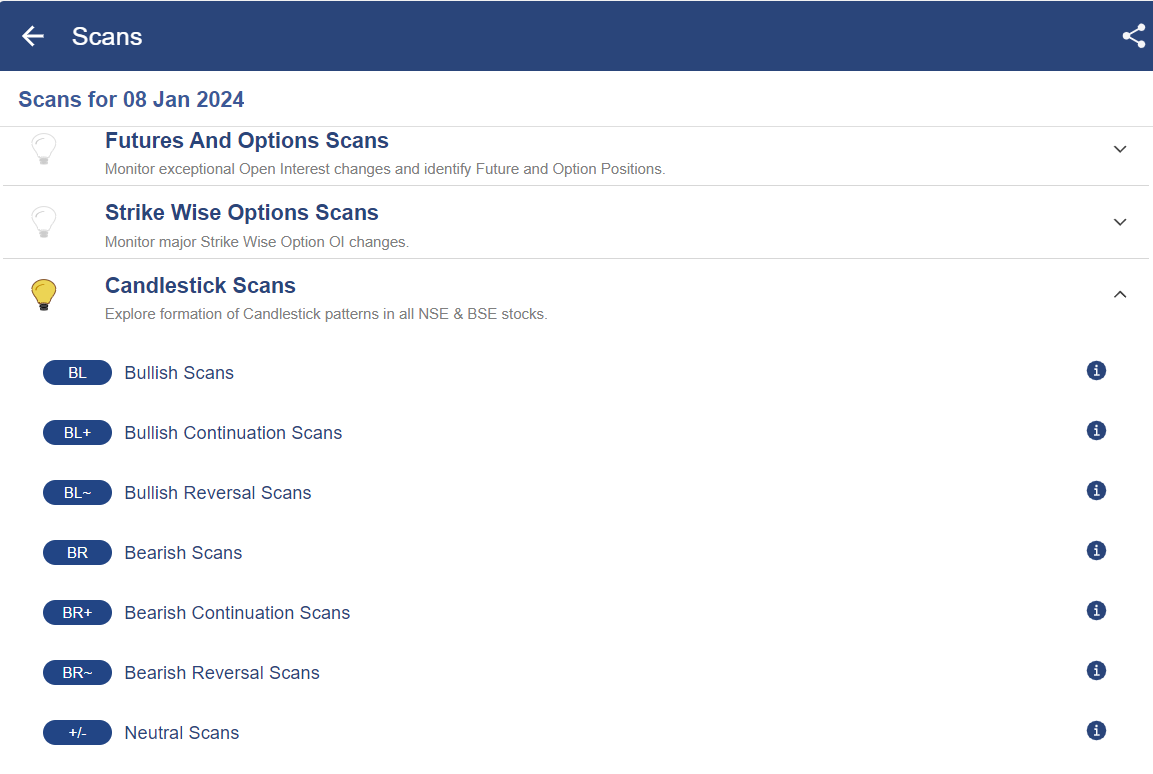
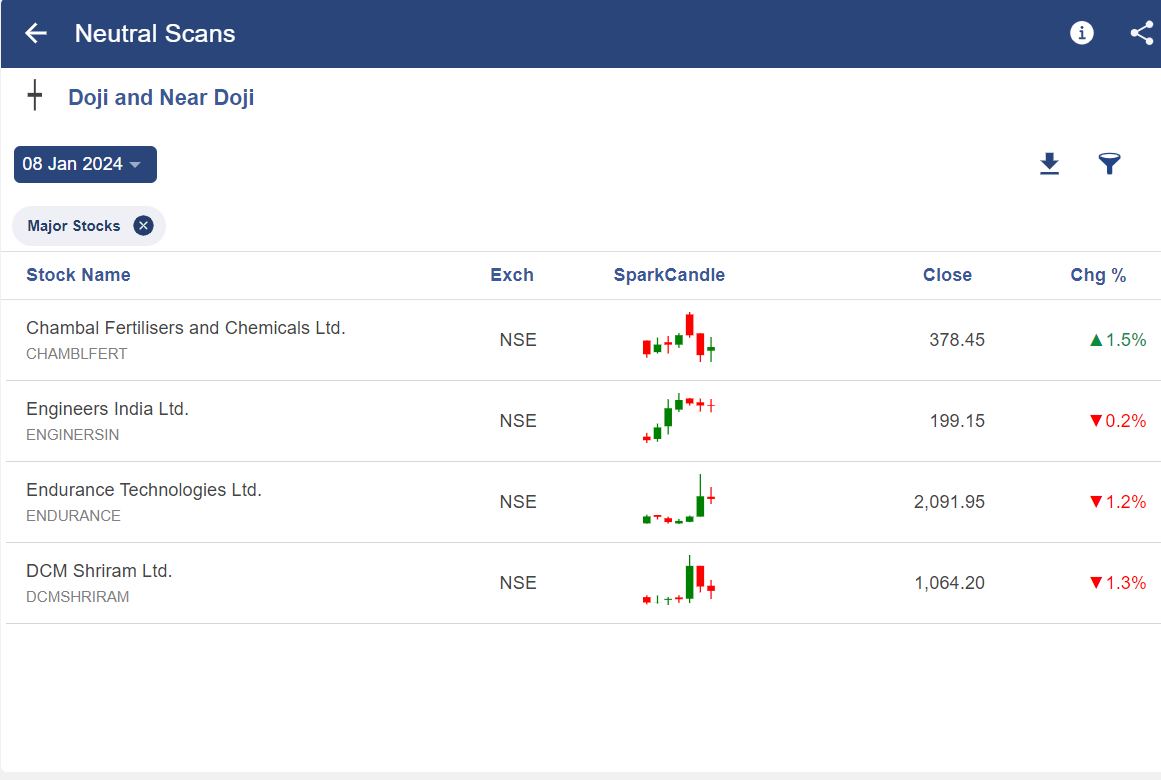
- When we click on the “Neutral Scans” we can see “Doji” scan, click on that:
- After selecting it, you will get a list of stocks in which the “Doji” pattern is formed, as shown below:
Limitations of a Doji
In isolation, a Doji candlestick acts as a neutral indicator and provides little information.
Moreover, a Doji is not commonly formed, thus it is not a reliable tool for spotting things like price reversals.
When it does occur, it isn’t always reliable either. There is no guarantee that the price will continue in the expected direction following the confirmation candle.
It is also difficult to estimate the potential reward of a Doji.
Other technical techniques, like other candlestick patterns, technical analysis indicators, or strategies, should be used with this candlestick pattern for making trading decisions.
Read More- All 35 Candlestick Chart Patterns in the Stock Market
Bottomline
A Doji is a candlestick pattern that looks like a cross, formed when the opening and closing prices are the same or nearly equal. It signals indecision in the market, where neither buyers nor sellers have the upper hand. There are several variations of the Doji, such as the Common Doji, Gravestone Doji, Dragonfly Doji, and Long-Legged Doji. However, a Doji should not be interpreted in isolation—it’s important to consider other patterns and technical indicators for confirmation. If you’re looking to understand these formations better, our chart pattern PDF offers a detailed overview of Doji and other key candlestick patterns.
Frequently Asked Questions (FAQs)
Is a Doji Candle Bullish or Bearish?
Notably, if the closing price is below the candle’s middle—especially if it is near resistance levels—the Doji is a negative signal. On the other hand, it is bullish since the formation resembles a bullish pin bar pattern if the closing price is above the candle’s middle.
What does the Doji Candlestick Indicate?
A candlestick chart, a common trading chart, has a unique pattern called a Doji. It stands out due to its brief duration, which denotes a constrained trading range. The brief duration suggests that there are little to no differences between the traded financial asset’s opening and closing values.


You have given best candlestick pattern example which help people to understand about technical skills
Hi,
Thank you for reading our blog!!
Keep Reading!
Good and easy to understand. Also i appreciate your way of teaching very much.
Hi,
Thank you for reading our blog!!
Keep Reading!
Description and explanations are good and smart. But Doji in isolation is of no use and if somebody acts only on the basis of Doji then chances of sucess are 50:50.
In general, most of candle stick pattern’s success rate is around 50:50 because today in the times of technology everybody knows it. Any business which is open to everyone, is always highly competitive which always results in success ratio of 50:50
Excellent feature of spotting doji pattern occurrence with minimal efforts under neutral scan!!
Need to learn its application and use though.
Nice explanation
Hi,
We are glad that you liked our blog post.
Thank you for Reading!
very helpful as a beginner to me.
Hi,
Thank you for Reading!
Keep Reading!
Great explanation
Hi,
Thank you for Reading!
Keep Reading
Very nice, give more figure explanation thanks🙏