
The Channel chart pattern is a continuation pattern which is formed by the combination of two lines.
These two lines are parallel to each other and they resemble a channel when drawn on the price chart.
The upper line of the channel acts as the resistance line whereas the lower line acts as the support line.
When the direction of a channel is upward then it is considered the bullish channel whereas when the direction of the channel is in the downward direction then it is called a bearish channel.
Let us discuss the formation of channel chart pattern and how to trade with it:
What is Channel Chart Pattern?
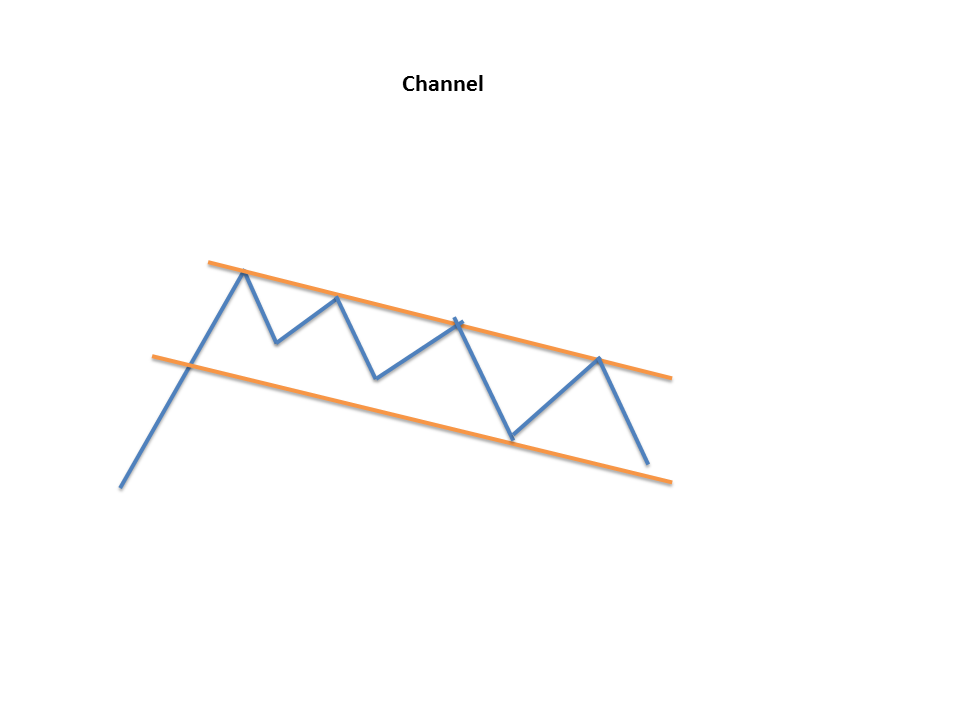
A channel chart pattern is characterized as the addition of two parallel lines which act as the zones of support and resistance.
The upper trend line or the resistance connects a series of highs.
The lower trend line or the support connects a series of lows.
Below is the formation of the channel chart pattern:
Types of Channels:
Here are the different types of Channel Patterns:
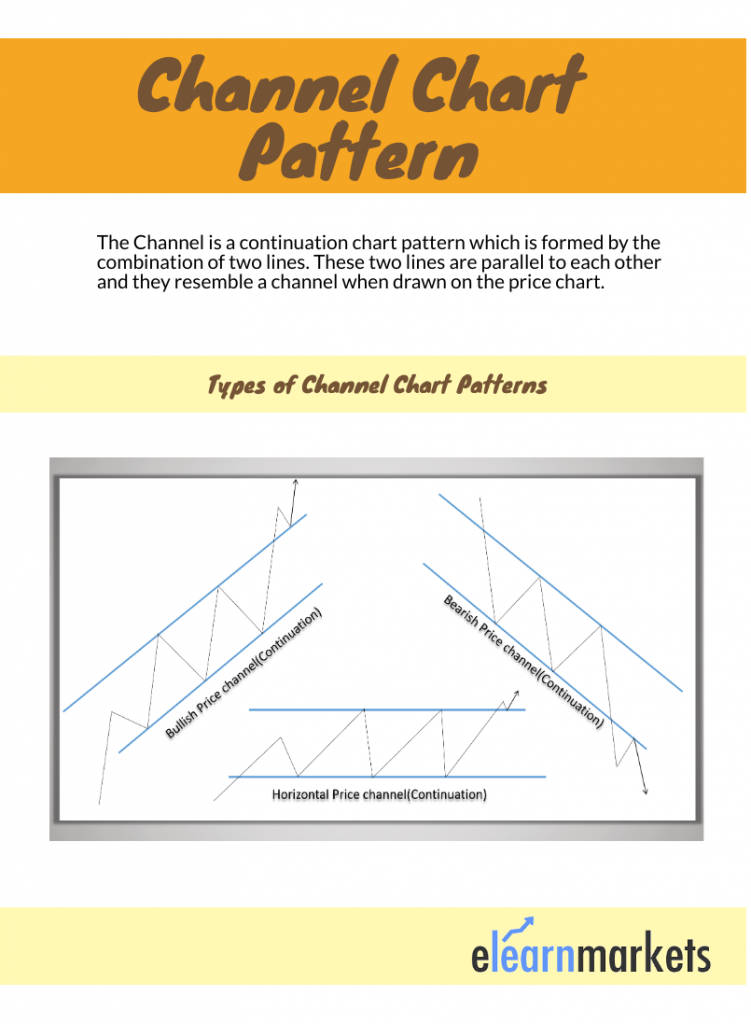
Bullish Channel Pattern:
A bullish channel is a continuation pattern having a positive slope.
If the prices break from the upper channel line then it indicates the continuation of the prior bullish trend.
On the other hand, if the prices break the lower channel line, then traders can exit their long position and build a short position.
However, instead of taking the entire short here, traders can wait for a pullback.
Bearish Channel Pattern:
A bearish channel is a continuation pattern having a negative slope.
If the prices break from the lower channel line then it indicates the continuation of the prior bearish trend.
On the other hand, if the prices break the upper channel line, then traders can exit their short position and build a long position.
Learn about Trend Lines & Chart Patterns using Technical Analysis in just 2 hours by Market Experts
Horizontal Channel Pattern:
This pattern can also be drawn when the price moves sideways or in a consolidation phase.
Here the channel pattern is used to just indicate the zones of support and resistance.
Trading with Channel Chart Pattern:
Traders will expect given security to trade between the two levels of support and resistance until it breaks beyond one of the levels.
Traders can expect a sharp move in the direction of the break.
Along with clearly displaying the trend, channels are mainly used to illustrate important areas of supports and resistance.
Example:
Below is the example of Bullish Channel formed in the daily chart of PNB Housing Finance Ltd.:

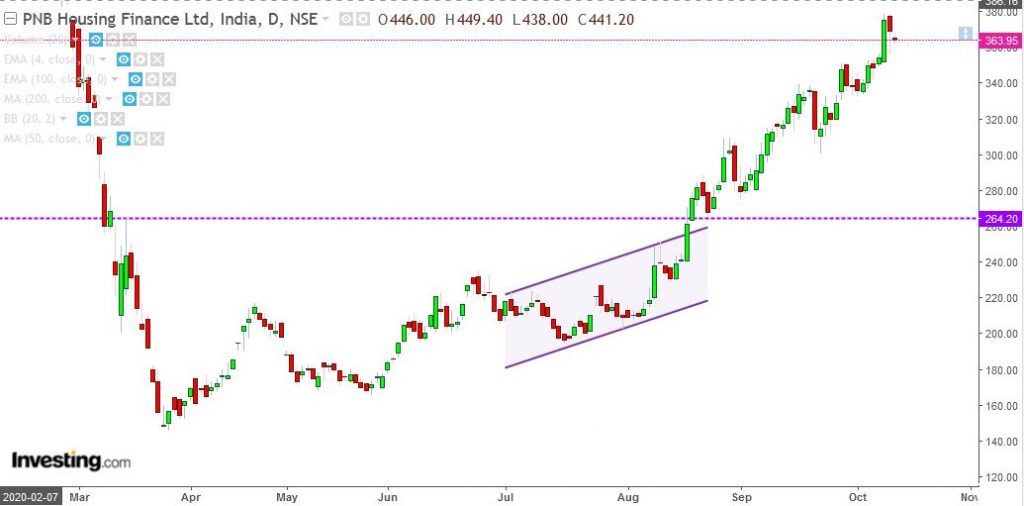
Stop-loss:
The stop loss can be set above the swing high before the price breakout from the channel.
Price target:
The price target can be set as the height of the channel.
Key Takeaways:
- The Channel is a continuation chart pattern which is formed by the combination of two lines.
- The upper line of the channel acts as the resistance line whereas the lower line acts as the support line.
- A bullish channel is a continuation pattern having a positive slope.
- A bearish channel is a continuation pattern having a negative slope.
- This pattern can also be drawn when the price moves sideways or in a consolidation phase.
Happy Learning!


One of the best content piece in days! Thank you so much.
Hi,
Thank you for Reading!
Keep Reading!
What an excellent blog on this topic. You have mentioned the points in a neat and easy to understand language. This guide is a full-fledged guide on channel chart pattern. The fact that you have covered most of the aspects makes it more interesting and worth reading. Thank you for sharing.
Hi,
Thank you for Reading!
Keep Reading!
Good work and content
Hi,
Thank you for Reading!
Keep Reading!