
The banking business is different from other businesses. So, we need to look at different parameters to perform basic banking stock analysis.
But, the basics will remain the same i.e., we will study the quality of the business through its numbers and other non-number parameters.
Banks’ primary business is to give out loans to different customers and charge interest on the loans.
Banks also have other fee-based businesses like credit card and debit card services, transferring money, insurance, mutual funds, etc.
How to perform banking stock analysis?
In this article, we will focus on the primary business of lending and how to perform banking stock analysis.
In order to provide loans, banks accept deposits and also borrow from other banks, financial institutions, and the Reserve Bank of India.
So, banks’ major income is in the form of interest income, and also the major expense is in the form of interest expense.
To evaluate the interest income, we have to look at their financials.
To illustrate how numbers and ratios are inferred, we have used HDFC Bank’s data as a case study.
We have here 15 ways in which we can evaluate a bank stock –
1. Interest Income
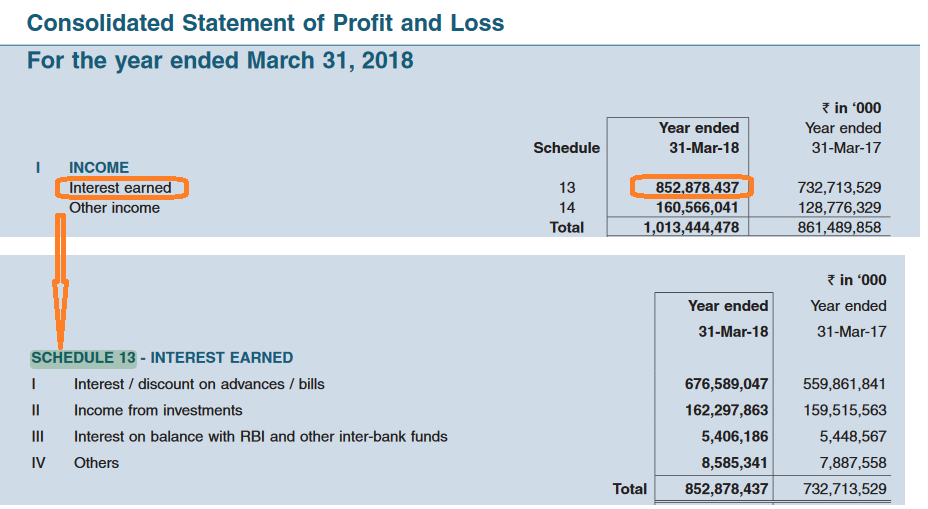
Extract of HDFC Bank’s Profit and loss statement showing Interest Earned.
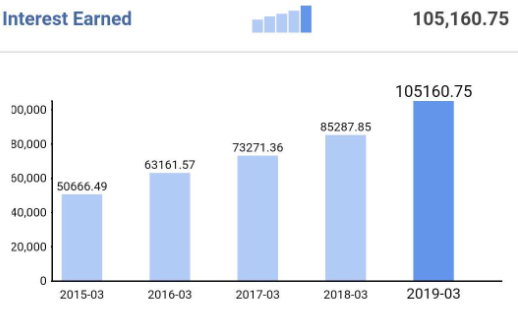
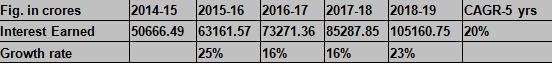
We see that interest earned by HDFC Bank rose at a CAGR of 20% in the last 5 years.
We can make a comparative table for comparing the CAGR of peer banks.
Also Read: Fundamental analysis of Stocks
A bank’s major expense is Interest Expense.
2. Net Interest Income
Net Interest Income (NII) is the difference between interest earned from a bank’s lending activities to its customers and the interest paid to account holders. If the spread between interest earned and interest expenses rises, it will help NII to rise and vice versa. This measure will give us a good idea about the principal business of the bank.
Net Interest Income = Interest Earned – Interest Expended
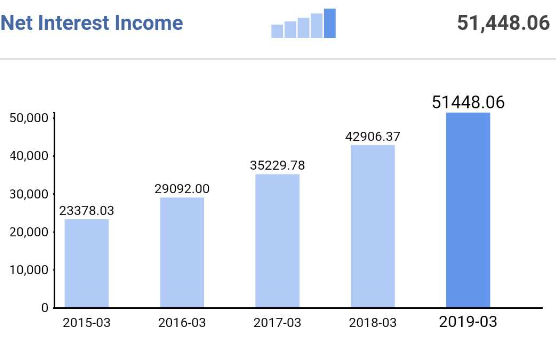
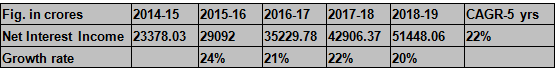
We can see that Net Interest Income grew at a rate of 22% CAGR over 5 years.
3. Net Interest Margin
Net Interest Margin is calculated by dividing Net Interest Income to Interest bearing assets such as loans and advances. It is to be compared over the years to assess the business of the banks.
Also Read : 22 Important Banking Terms you need to know
Net Interest Margin = (Net Interest Income/ Interest bearing Assets)*100
It is expressed in terms of percentage.
For FY: 2017-18
Net Interest Income = 42906.37 crores
Interest-bearing Assets = 10615563.17 crores
Net Interest Margin = (42906.37/10615563.17) * 100 = 4.04%
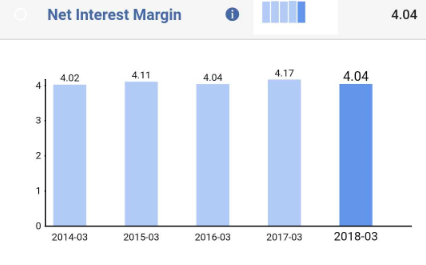
We can see that Net Interest Margin is at the same level throughout the last few years.
4. Cost to Income Ratio
The cost to Income ratio is the ratio of operating expenses to operating income (net interest + other income). It helps in assessing the profitability of the banks.
A lower ratio indicates higher profitability. If the ratio is rising over the years, it means costs are rising at a higher rate than income.
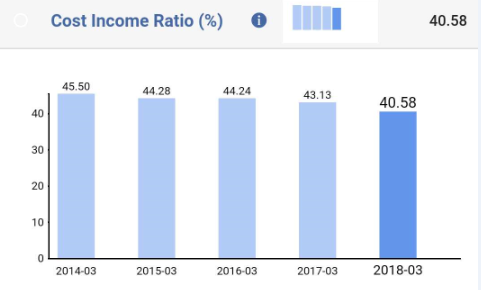
We can see that the cost-income ratio of HDFC Bank has slightly reduced over the years; it indicates costs have risen at a higher rate than income.
5. Net Profit
Like every business, we must check the net profit and compare it with previous years to understand the trend in the profitability of the business.

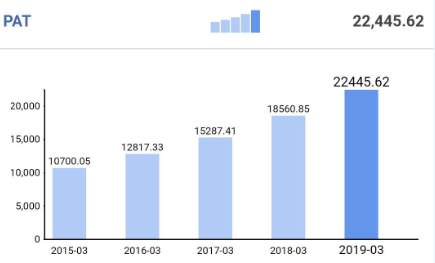
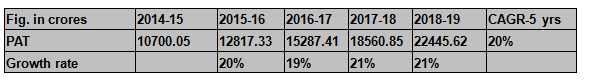
We can see that PAT increased steadily at a CAGR of 20% for the last 5 years.
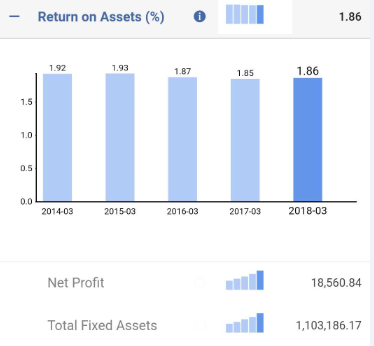
6. Return on Assets (ROA)
Return on Assets shows how profitable a bank is relative to its total assets. It also indicates how efficiently it is using its assets to generate earnings.
It is calculated by dividing Net Profit by Total Assets.
It is expressed in terms of percentage.
7. Return on Equity (ROE)
This ratio is used by the shareholders to measure their return on investment. ROE is calculated by dividing Net Profit by Net Worth (Capital + Reserves & Surplus).
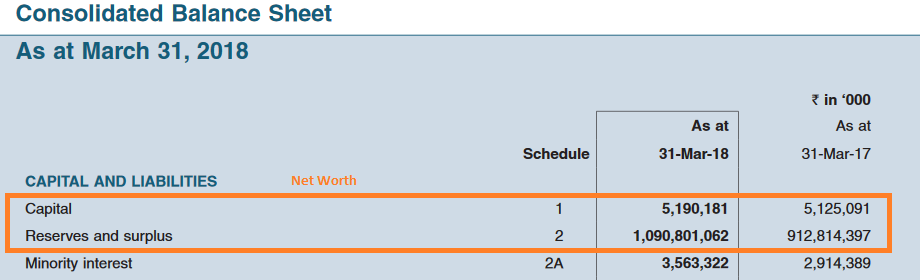
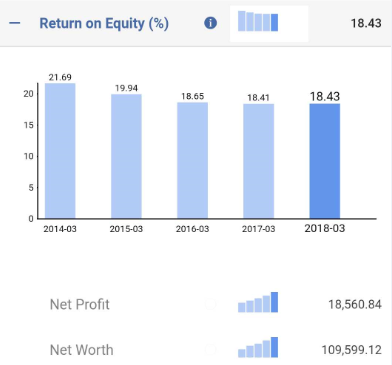
Return on Equity decreased from 2014 levels but is constant level for last 3 years.
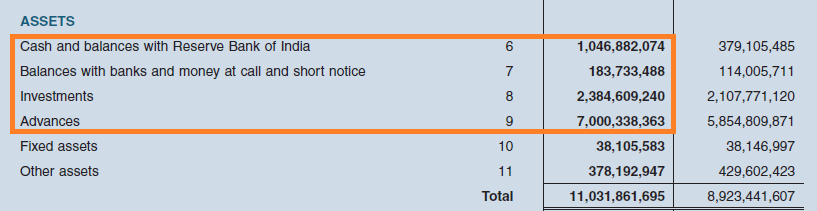
8. Total Advances
Total Advance is an important metric to look at because the bank’s primary earning comes from this asset. Advances are loans given out to customers and hence it is considered as assets in the business and one of the key part of banking stock analysis. The rise in assets and rate of rising will tell us how the bank is growing its business.
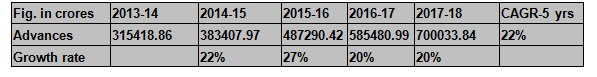
We can see the advances grew at a CAGR of 22% over the last 5 years.
9. Total Deposits
Deposits form a major source of funds for the banks. Banks accept deposits in the form of term deposits, savings, and current accounts. Banks lend out of the deposits it receives. Hence, analyzing deposits numbers will tell us how comfortably the banks are able to acquire funds to lend.
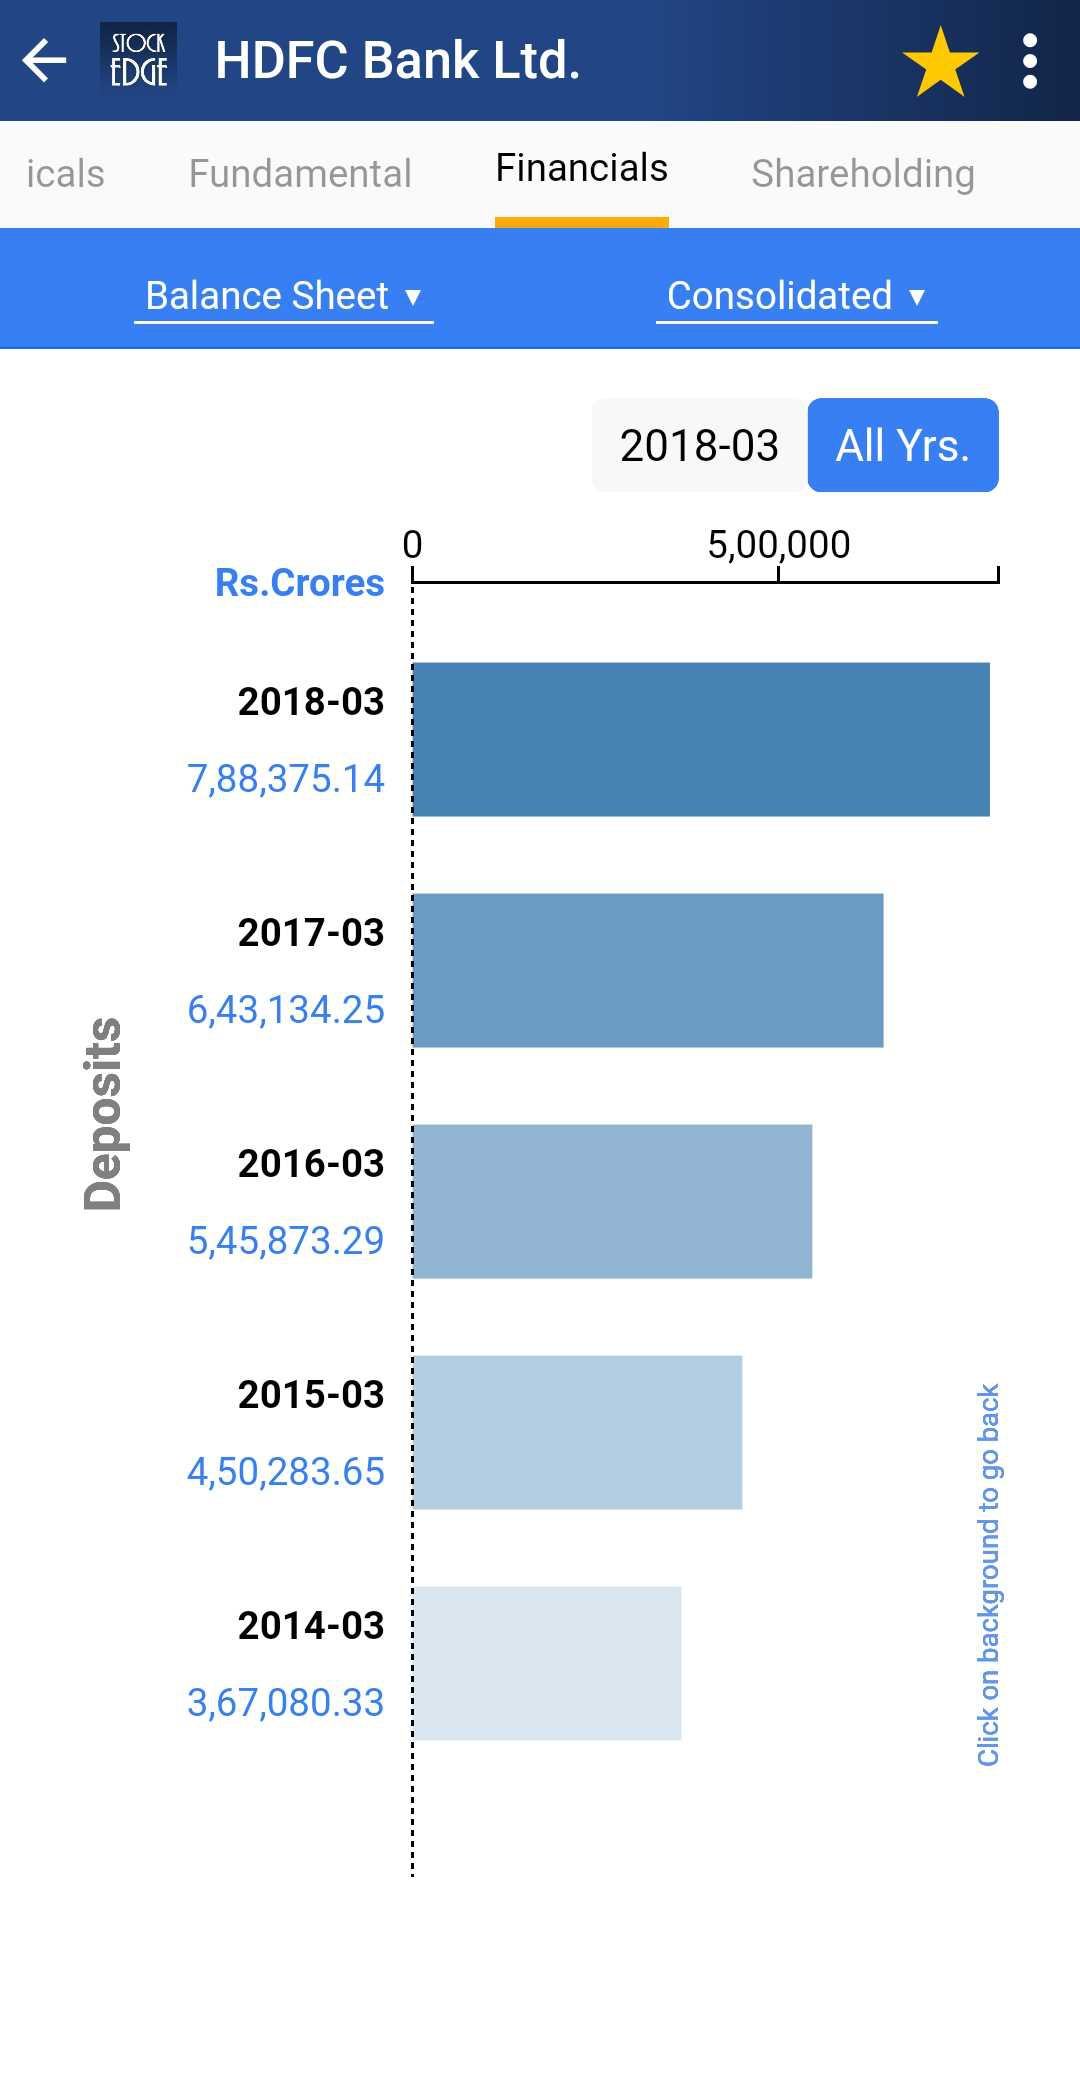
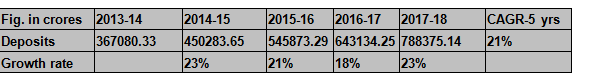
We can see that deposits also grew at a CAGR of 21% over the last 5 years.
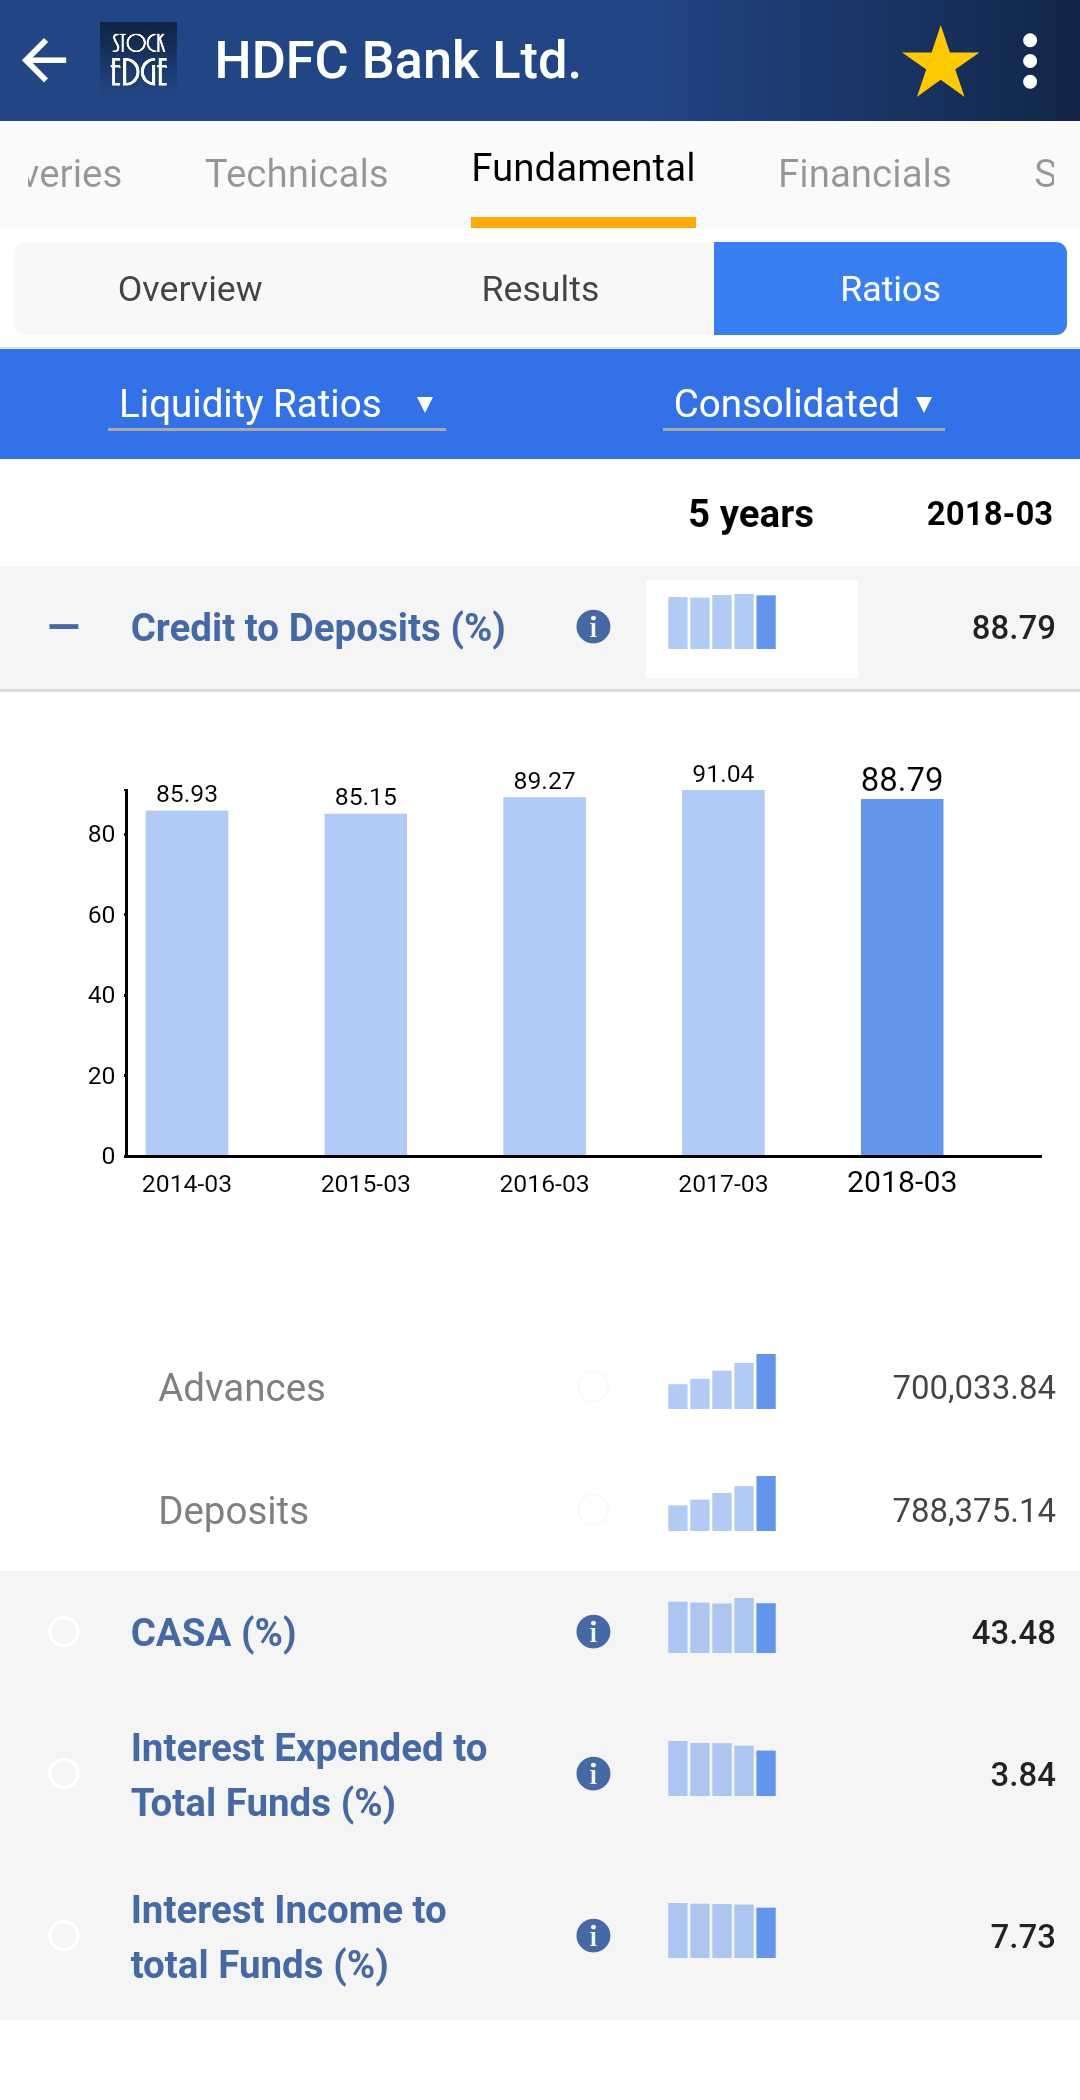
10. Loans to Deposit Ratio or Credit to Deposits Ratio
Loan to Deposits is used for measuring the bank’s liquidity. An optimum level of liquidity is considered good.
A high ratio may indicate a possible liquidity crunch and a low ratio indicates the under-utilization of funds.

11. CASA Ratio
CASA ratio of a bank is the ratio of deposits in current and savings accounts to total deposits. A higher CASA ratio is desired because banks give a low rate of interest in savings account (3-4%) deposits and no interest in current account deposits. A high CASA ratio indicates a lower cost of funds.
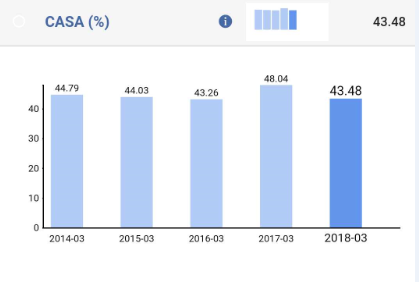
It means around 43% of the total deposits are from current and savings accounts.
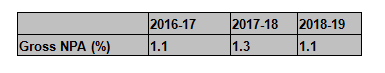
12. Gross NPAs
A loan asset becomes non-performing when it ceases to generate any income for the bank. Gross NPAs are the total loans classified by the banks as non-performing. Higher NPAs are adverse for the banks. This should be checked to determine the asset quality of the banks.
Download E-Book: Banking Awareness Book for Beginners
The Gross NPA ratio is the ratio of gross non-performing assets to gross advances.
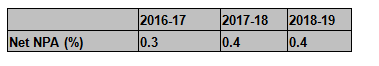
13. Net NPAs
Net NPA is Gross NPA – (Balance in Interest Suspense account DICGC/ECGC claims received and held pending adjustment + Part-payment received and kept in suspense account + Total provisions held).
Net NPA ratio is the ratio of net non-performing assets to net advances.
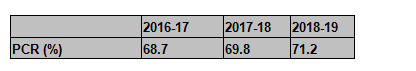
14. Provision Coverage Ratio (PCR)
PCR is the ratio of the total provision balances of the bank to gross NPAs. PCR ratio indicates the extent to which the bank has provided for the weaker part of its loan portfolio. A high ratio suggests that further provisions to be made by the bank in the coming years would be relatively low unless the GNPAs rise at a faster rate.
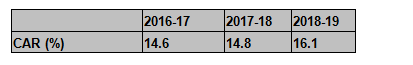
15. Capital Adequacy Ratio (CAR)
Capital Adequacy Ratio is the ratio of a bank’s capital to aggregated risk-weighted assets. It is also known as the capital to risk-weighted assets ratio (CRAR). It is decided by central banks to prevent commercial banks from taking excess leverage.
The Basel III norms stipulated a capital to risk-weighted assets of 8%. However, as per RBI norms, Indian scheduled commercial banks are required to maintain a CAR of 9% while Indian public sector banks are emphasized to maintain a CAR of 12%.
CAR = (Tier-I capital + Tier-II capital)/ Risk-weighted Assets
Tier-I Capital
Tier-I capital consists of equity capital, statutory reserves+ disclosed free reserves. Tier-I capital is used to absorb losses and does not require a bank to cease operations.
Tier-II Capital
Tier-II capital comprises retained earnings, unaudited reserves, general loss reserves, and hybrid debt capital instruments. This capital absorbs losses in the event of a company winding up or liquidating.
Risk-weighted Assets
Risk-weighted assets mean fund-based assets such as cash, loans, investments, and other assets. Degrees of credit risk expressed as percentage weights are assigned by the banking regulator to each such asset.
Key Takeaways for performing banking stock analysis:
PEERS: These ratios should be compared with peer banks and the industry average to decide the position of a bank with respect to its competitors and whether one should invest in that particular banking stock or not.
Economic slowdown: Loan business broadly imitates India’s GDP mix by catering to the consumption theme. A slower-than-expected pickup in India’s economic growth or a slowdown in job creation coupled with a sharp rise in interest rates could affect demand for retail loans and margins.
Business Portfolio: We have studied the business portfolio of the banks to get a better idea of their business model. The loan mix of corporate and retail loans can be the differentiator of performance between two banks. Corporate loans are riskier than retail loans.
Impact of Regulators: The banking industry is highly regulated by the central bank. The regulator’s decision regarding various aspects like maintenance of cash reserve ratio (CRR), statutory liquidity ratio (SLR), and repo rates affect banking business.
To know more, hop in to our share analysis website.


Would love to forever get updated great website! .
All in all, a great article and hope to read other informative articles on banks stocks, however, You might wanna check the description of cost to income ratio once again.
You mentioned that the lower the ratio better the banks profitability (lower cost relative to the income) but when explaining the chart you mentioned that the ratio was decreasing (which quoting the previous statement is good for the bank) but you mentioned that the cost was increasing than its income signifying that the decreasing ratio is a bad sign.
Hi,
What we meant by looking at the ratio is that the decline in Cost to income ratio was not in sync with the rise in NIIM
and due to this, it can be said that the rise in NIIM could not offset the similar percentage decline in cost to income ratio. This means the ratio declined by 5.91% but the NIIM rose by 19.90%.
Now since cost to income ratio is the ratio between operating expenses and operating income so if Income rose by 20% then the ratio shud have declined more but as the operating expenses also rose a lot so the decline by 5.91% was very small.
Thus we wrote that the cost-income ratio of HDFC Bank has slightly reduced over the years; it indicates costs have risen at a higher rate than income.
Because of the way NIIM is rising costs will also rise but if costs rise in near equal proportion to NIIM
then in any negative circumstances, the bank would not be able to maintain its costs thus affecting the ratio negatively for the company.
Thank you for Reading!