Elearnmarkets - Financial Market Learning
  • Categories
    • Basic Finance
    • Derivatives
      • Futures
      • Options
    • Financial Planning
    • Fundamental Analysis
    • Technical Analysis
    • Marketshala
    • Miscellaneous
  • Language
    • English
    • Hindi
    • Bengali
No Result
View All Result
  • Courses
  • Webinars
  • Stories
Elearnmarkets - Learn Stock Market, trading, investing for Free
No Result
View All Result
Home Technical Analysis
Abandoned baby Candlestick Pattern - Bullish & Bearish Abandoned baby 1

Abandoned baby Candlestick Pattern – Bullish & Bearish Abandoned baby

Elearnmarkets by Elearnmarkets
January 19, 2023
in Technical Analysis
Reading Time: 6 mins read
10
9.5k
VIEWS
Share on FacebookShare on XShare on WhatsApp

The abandoned baby pattern is a multiple candlestick reversal patterns.

This candlestick pattern is similar to the morning and evening star candlestick patterns.

The main difference between this pattern and morning star and evening star is that real bodies and shadows cannot overlap. 

Due to this, the abandoned baby pattern is a unique and reliable candlestick pattern. 

While this candlestick pattern has a baby in its name the formation of this is similar to the island reversal pattern.

Table of Contents
What is Bullish Abandoned Candlestick Pattern?
What is Bearish Abandoned Candlestick Pattern?
Formation of Abandoned Baby Pattern
What does Abandoned Baby Candlestick Pattern tell us?
Trading with Abandoned Baby Candlestick Pattern
Key Takeaways

What is Bullish Abandoned Candlestick Pattern?

The bullish abandoned baby pattern signals reversal to an uptrend and is used by the traders to enter a buy position.

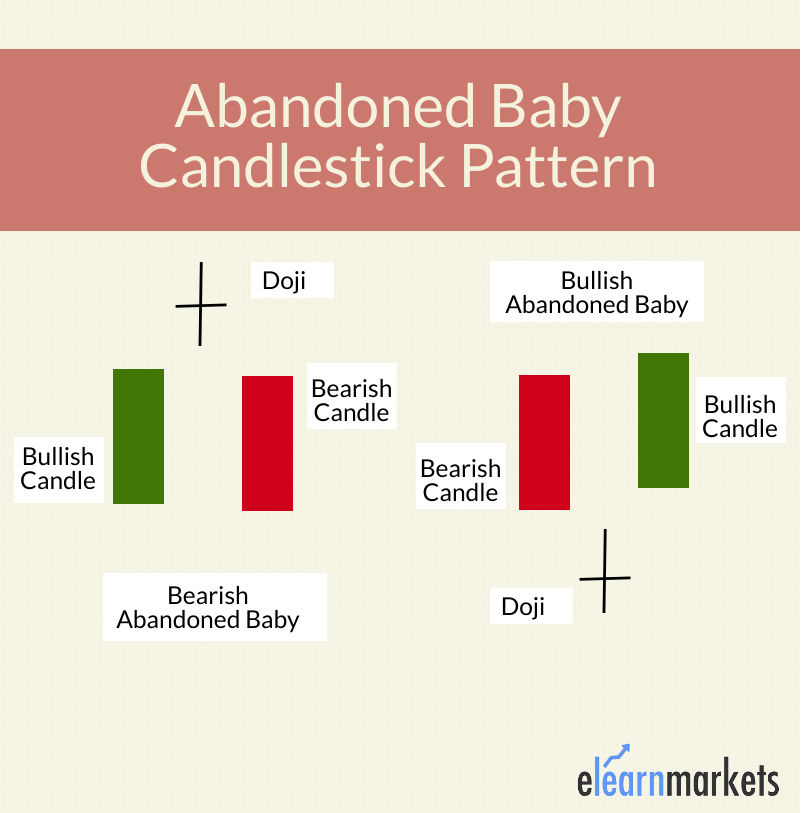
It is formed at the end of a downtrend and is composed of three candlesticks.

RelatedPosts

5 Powerful Bearish Candlestick Patterns 2

5 Powerful Bearish Candlestick Patterns

November 30, 2023
98.3k
5 Powerful Bullish Candlestick Patterns 3

5 Powerful Bullish Candlestick Patterns

November 30, 2023
135.6k
All 35 Candlestick Chart Patterns in the Stock Market-Explained 4

All 35 Candlestick Chart Patterns in the Stock Market-Explained

November 27, 2023
2.1M

The first candlestick is a large bearish candle that is followed by a Doji candle that gaps down.

The third candlestick opens higher than the Doji and is usually a bullish candle.

After the formation of this pattern, traders expect that the price will continue to move up and bulls are back into action.

What is Bearish Abandoned Candlestick Pattern?

The bearish abandoned baby pattern signals reversal to the downtrend and is used by the traders to exit a buy position and enter a short position.

It is formed at the end of an uptrend and is composed of three candlesticks.

The first candlestick is a large bullish candle that is followed by a Doji candle that gaps up.

The third candlestick opens lower than the Doji and is usually a bearish candle.

After the formation of this pattern, traders expect that the price will continue to move down and bears are back into action.

Learn to Identify Trend Reversals with Candlesticks in just 2 hours by Market Experts

Formation of Abandoned Baby Pattern:

Here is the formation of Abandoned Baby Candlestick Pattern:

abandoned-baby-pattern

What does Abandoned Baby Candlestick Pattern tell us?

As we have discussed above abandoned baby pattern is a reversal candlestick pattern.

A bullish abandoned baby pattern signals an end of the selling pressure of the bears and the return of the bulls in the market.

On the other hand, bearish abandoned baby signals that bulls are leaving and indicate the return of the bears in the market.

The psychology behind the formation of a bullish abandoned baby suggests that the market has witnessed a significant sell-off in the first candle.

Because of this reason a bearish candlestick is formed.

A Doji candlestick pattern is formed afterward, which confirms that now a market is uncertain as to the opening and closing prices are the same.

In this case, it indicates that the bears are losing their grip and the bulls are taking over the market.

The third bullish candle confirms that the trend has been reversed to an uptrend and also gaps higher from the Doji.

The psychology behind the formation of the bearish abandoned baby suggests that the market has witnessed a significant buy-off in the first candle.

Because of this reason a bullish candlestick is formed.

A Doji forms afterward, which confirms that now a market is uncertain as to the opening and closing prices are the same.

In this case, it indicates that the bulls are losing their grip and the bears are taking over the market.

The third bearish candle confirms that the trend has been reversed to the downtrend and also gaps lower from the Doji.

Trading with Abandoned Baby Candlestick Pattern:

Traders should remember the following points when they trade with this candlestick Pattern:

  • The prior trend should be an uptrend in the case of the Bearish Abandoned Baby pattern and the prior trend should be downtrend in the case of the Bullish Abandoned Baby pattern.
  • The shadows and real bodies should not overlap with each other.
  • The third candle should be in the opposite direction of the first-day candle and also should gap in the opposite direction of the Doji.

Traders can place a stop-loss just below the down shadow of the Doji in the case of a bullish abandoned baby.

Similarly, in the case of bearish abandoned baby traders can place a stop-loss just above the upper shadow of the Doji.

Traders should confirm the formation of this pattern with other trading tools like Fibonacci Retracement, or the moving average.

Key Takeaways:

  • The abandoned baby candlestick pattern is a multiple candlestick reversal pattern.
  • The bearish abandoned baby signals reversal to the downtrend and is used by the traders to exit a buy position and enter a short position.
  • The bullish abandoned baby signals reversal to an uptrend and is used by the traders to enter a buy position.
  • Traders should confirm the formation of this pattern with other trading tools like Fibonacci Retracement, or the moving average indicator.

Happy Learning!

Tags: abandoned baby candlestickcandlestick beginners guideenglishtechnical basics
ShareTweetSend
Get Kotak Offer Get Kotak Offer Get Kotak Offer
Previous Post

Bull Call Spread Options Strategy – All you should know

Next Post

The Essential Guide to Bulk and Block Deals

Elearnmarkets

Elearnmarkets

Elearnmarkets (ELM) is a complete financial market portal where the market experts have taken the onus to spread financial education. ELM constantly experiments with new education methodologies and technologies to make financial education effective, affordable and accessible to all. You can connect with us on Twitter @elearnmarkets.

Related Posts

5 Powerful Bearish Candlestick Patterns 5
Technical Analysis

5 Powerful Bearish Candlestick Patterns

November 30, 2023
98.3k
5 Powerful Bullish Candlestick Patterns 6
Technical Analysis

5 Powerful Bullish Candlestick Patterns

November 30, 2023
135.6k
All 35 Candlestick Chart Patterns in the Stock Market-Explained 7
Charts, Patterns & Indicators

All 35 Candlestick Chart Patterns in the Stock Market-Explained

November 27, 2023
2.1M
Super Successful Techno Funda Stock Market Strategy 8
Fundamental Analysis

Super Successful Techno Funda Stock Market Strategy

November 28, 2023
1.6k

Comments 10

  1. G.gangansik says:
    3 years ago

    I am extremely hsppy about your efforts in educating retail entrants.it gives me lot of interest to lern when to enter in buy /sell. God bless u & takes to u higher & higher. All the best.

    Reply
    • Sakshi Agarwal says:
      3 years ago

      Hi,

      We are glad that you liked our blog post.

      Thank you for Reading!

      Reply
  2. Varun Sharma says:
    3 years ago

    Thanks for sharing the valuable information.

    Reply
    • Sakshi Agarwal says:
      3 years ago

      Hi,

      We are glad that you liked our blog post.

      Thank you for Reading!

      Reply
  3. Darshan says:
    3 years ago

    such great information., Thank you for sharing with us..,

    Reply
    • Sakshi Agarwal says:
      3 years ago

      Hi,

      We are glad that you liked our blog post.

      Thank you for Reading!

      Reply
  4. Sharanpreet Kaur says:
    3 years ago

    Very well explained about the things. Keep going.

    Reply
    • Sakshi Agarwal says:
      3 years ago

      Hi,

      Thank you for Reading!

      Keep Reading!

      Reply
  5. Aman says:
    3 years ago

    The blog is really good. Thanks for sharing it.

    Reply
    • Sakshi Agarwal says:
      3 years ago

      Hi,

      Thank you for reading our blog!!

      Keep Reading!

      Reply

Leave a Reply Cancel reply

Your email address will not be published. Required fields are marked *

Elearnmarkets Logo

Follow Us

Facebook-f Twitter Instagram Linkedin-in Youtube Telegram

Register on Elearnmarkets

Continue your financial learning by creating your own account on Elearnmarkets.com

Register Free Account

Download App

Playstore logo
Download on app store

Categories

  • Basic Finance
  • Derivatives
  • Financial Planning
  • Fundamental Analysis
  • Technical Analysis
  • Marketshala
  • Miscellaneous

Popular On Elearnmarkets

  • Market Superheroes:
  • Vivek Bajaj
  • Chetan Panchamia
  • Ashish Kyal
  • Premal Parekh
  • Abhijit Paul
  • Jegan
  • Sivakumar Jayachadran
  • Vishal Malkan
  • Jyoti Budhia
  • Vivek Gadodia
  • Vishal Mehta
  • Piyush Chaudhry
  • Santosh Pasi
  • Gomathi Shankar
  • Market Superheroes:
  • Vivek Bajaj
  • Chetan Panchamia
  • Ashish Kyal
  • Premal Parekh
  • Abhijit Paul
  • Jegan
  • Sivakumar Jayachadran
  • Vishal Malkan
  • Jyoti Budhia
  • Vivek Gadodia
  • Vishal Mehta
  • Piyush Chaudhry
  • Santosh Pasi
  • Gomathi Shankar
  • Courses:​
  • Options Trading
  • Dow Theory
  • Momentum Trading
  • Stock Investing
  • Stock Market for Beginners
  • Harmonic Chart Patterns
  • Algo Trading
  • Elliot Wave Theory
  • Advanced Excel
  • Cryptocurrency
  • NSE Certification Course
  • Courses:​
  • Options Trading
  • Dow Theory
  • Momentum Trading
  • Stock Investing
  • Stock Market for Beginners
  • Harmonic Chart Patterns
  • Algo Trading
  • Elliot Wave Theory
  • Advanced Excel
  • Cryptocurrency
  • NSE Certification Course
  • Webinars:
  • Bank Nifty Scalping
  • Intraday Trading Strategies
  • Options Trading Strategies
  • Options selling
  • Price Action
  • Relative Strength
  • Tax Planning
  • Options Buying
  • Growth Stocks
  • Portfolio Management
  • Relative Strength Index
  • Risk Management
  • Renko Charts
  • Crude Oil
  • Traders Psychology
  • Moving Average
  • Multibagger Stocks
  • Free Learning Modules:
  • Intraday Trading
  • Options Scalping
  • Swing Trading
  • Financial Modelling
  • RSI Indicator
  • Bollinger Bands
  • Pricing of Futures
  • Personal Finance
  • Initial Public Offerings (IPO)
  • Value Investing
  • Technical Indicators
  • Candlesticks
  • Chart Patterns
  • Option Greeks
  • ELSS Funds
  • Banking and Insurance
  • Real Estate
  • Gold
  • Book Summaries:
  • Rich Dad Poor Dad
  • Psychology of Money
  • The Intelligent Investor
  • The Richest Man in Babylon
  • Think and Trade Like a Champion
  • Value Investing and Behavioural Finance
  • Trading in the Zone
  • Learn to Earn
  • Book Summaries:
  • Rich Dad Poor Dad
  • Psychology of Money
  • The Intelligent Investor
  • The Richest Man in Babylon
  • Think and Trade Like a Champion
  • Value Investing and Behavioural Finance
  • Trading in the Zone
  • Learn to Earn
  • Tools:
  • CAGR Calculator
  • SIP Calculator
  • eLearnOptions
  • Future Value Calculator
  • Present Value Calculator
  • Atal Pension Yojana
  • Cost of Delay Calculator
  • Become a Crorepati
  • Tools:
  • CAGR Calculator
  • SIP Calculator
  • eLearnOptions
  • Future Value Calculator
  • Present Value Calculator
  • Atal Pension Yojana
  • Cost of Delay Calculator
  • Become a Crorepati

© 2023 Elearnmarkets. All Rights Reserved

  • Visit Elearnmarkets
  • Courses
  • Webinars
  • Financial Guides
  • Get Free Counselling
  • Visit Elearnmarkets
  • Courses
  • Webinars
  • Financial Guides
  • Get Free Counselling

Get Elearnmarkets App

No Result
View All Result
  • Article Categories
    • Basic Finance
    • Derivatives
    • Financial Planning
    • Fundamental Analysis
    • Technical Analysis
    • Marketshala
    • Miscellaneous
  • Language
    • Hindi
    • Bengali
    • English
  • Courses
  • Webinars
  • Stories

© 2020 Elearnmarkets All Rights Reserved

A Handbook of Technical Analysis
To start your trading journey as a seasoned technical analyst
Download Now