The term ‘Technical Analysis’ means studying the actions and movements in the market to determine your actions. It identifies trade opportunities by studying the strengths and weaknesses of a security. It means graphically recording market history to predict possible future trends. No doubt, it is one of the best way to find right trade, but there are certain problems in technical analysis that a novice trader make.
Now, the definition itself hints that it’s no cakewalk. Technical Analysis is that trading tool in the stock market that is going to raise problems for any firsthand investor. It’s important to find ways to overcome them so that we can face the market without fear.
A few steps that will help you navigate through the problems of technical analysis :
1. Drawing of Price Action Patterns
Price action in technical analysis refers to movement in stock prices and getting trading cues from it.
Interpreting price action is very subjective and also one of the common problems in technical analysis. It’s common for two traders to arrive at different conclusions when analyzing the same price action. One may observe a bearish pulldown and another may think it shows a possible turnaround soon. As a result, many traders would be better off using price action as just one part of a larger strategy.
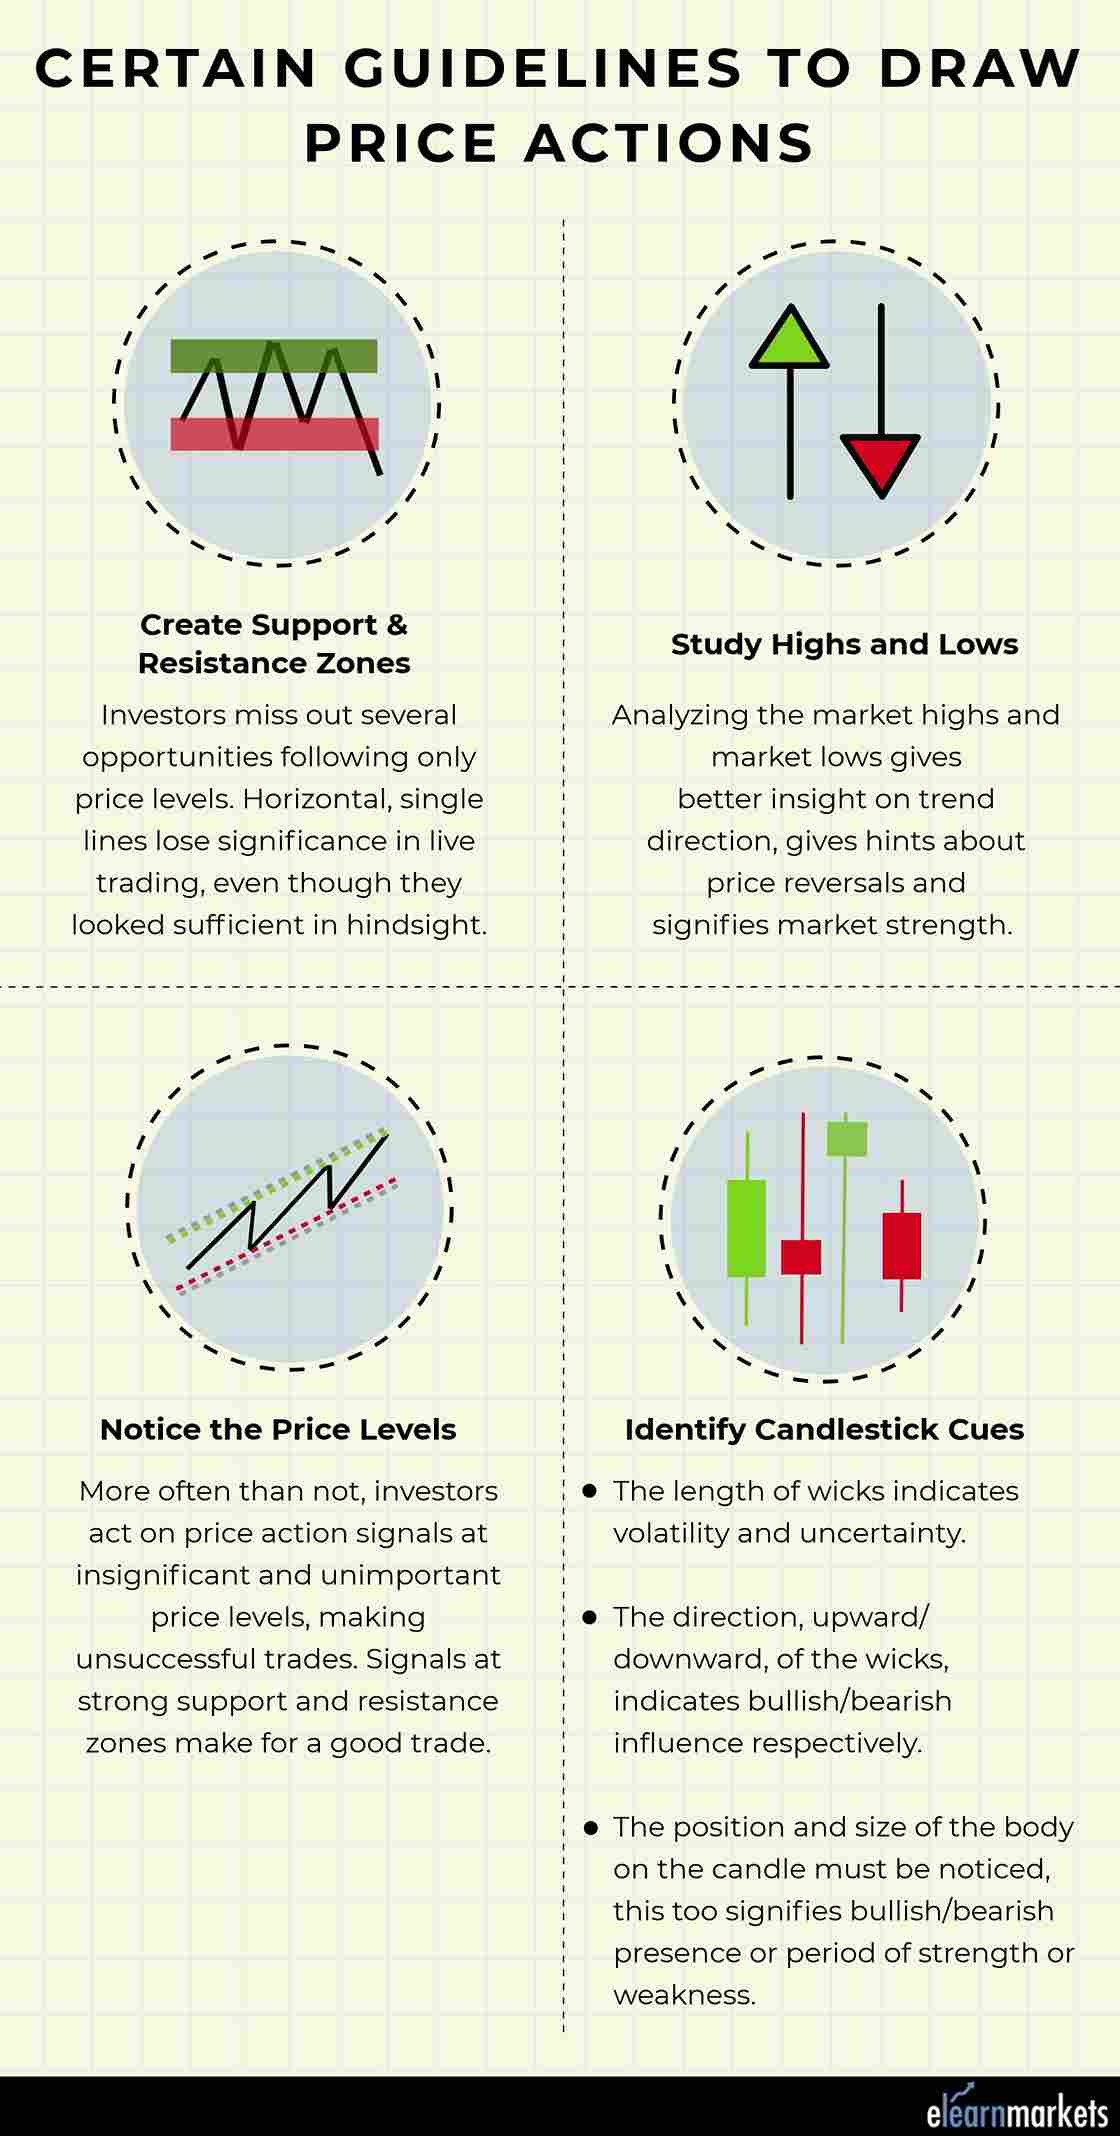
Hence, rules can’t be written in stone, but with a methodical study, certain guidelines may be:
- Create support and resistance zones
Investors miss out several opportunities following only price levels. Horizontal, single lines lose significance in live trading, even though they looked sufficient in hindsight. - Study Highs and Lows
Analyzing the market highs and market lows give better insight on trend direction, gives hints about price reversals and signifies market strength. - Notice the Price Levels
More often than not, investors act on price action signals at insignificant and unimportant price levels, which makes for an unsuccessful trade. Signals at strong support and resistance zones make for a good trade. - Identify Candlestick Clues
- The length of wicks indicates volatility and uncertainty.
- The direction, upward or downward, of the wicks, indicates bullish or bearish influence respectively.
- The position and size of the body on the candle must be noticed, this too signifies bullish or bearish presence or period of strength or weakness.
2. Be clear which patterns you trade
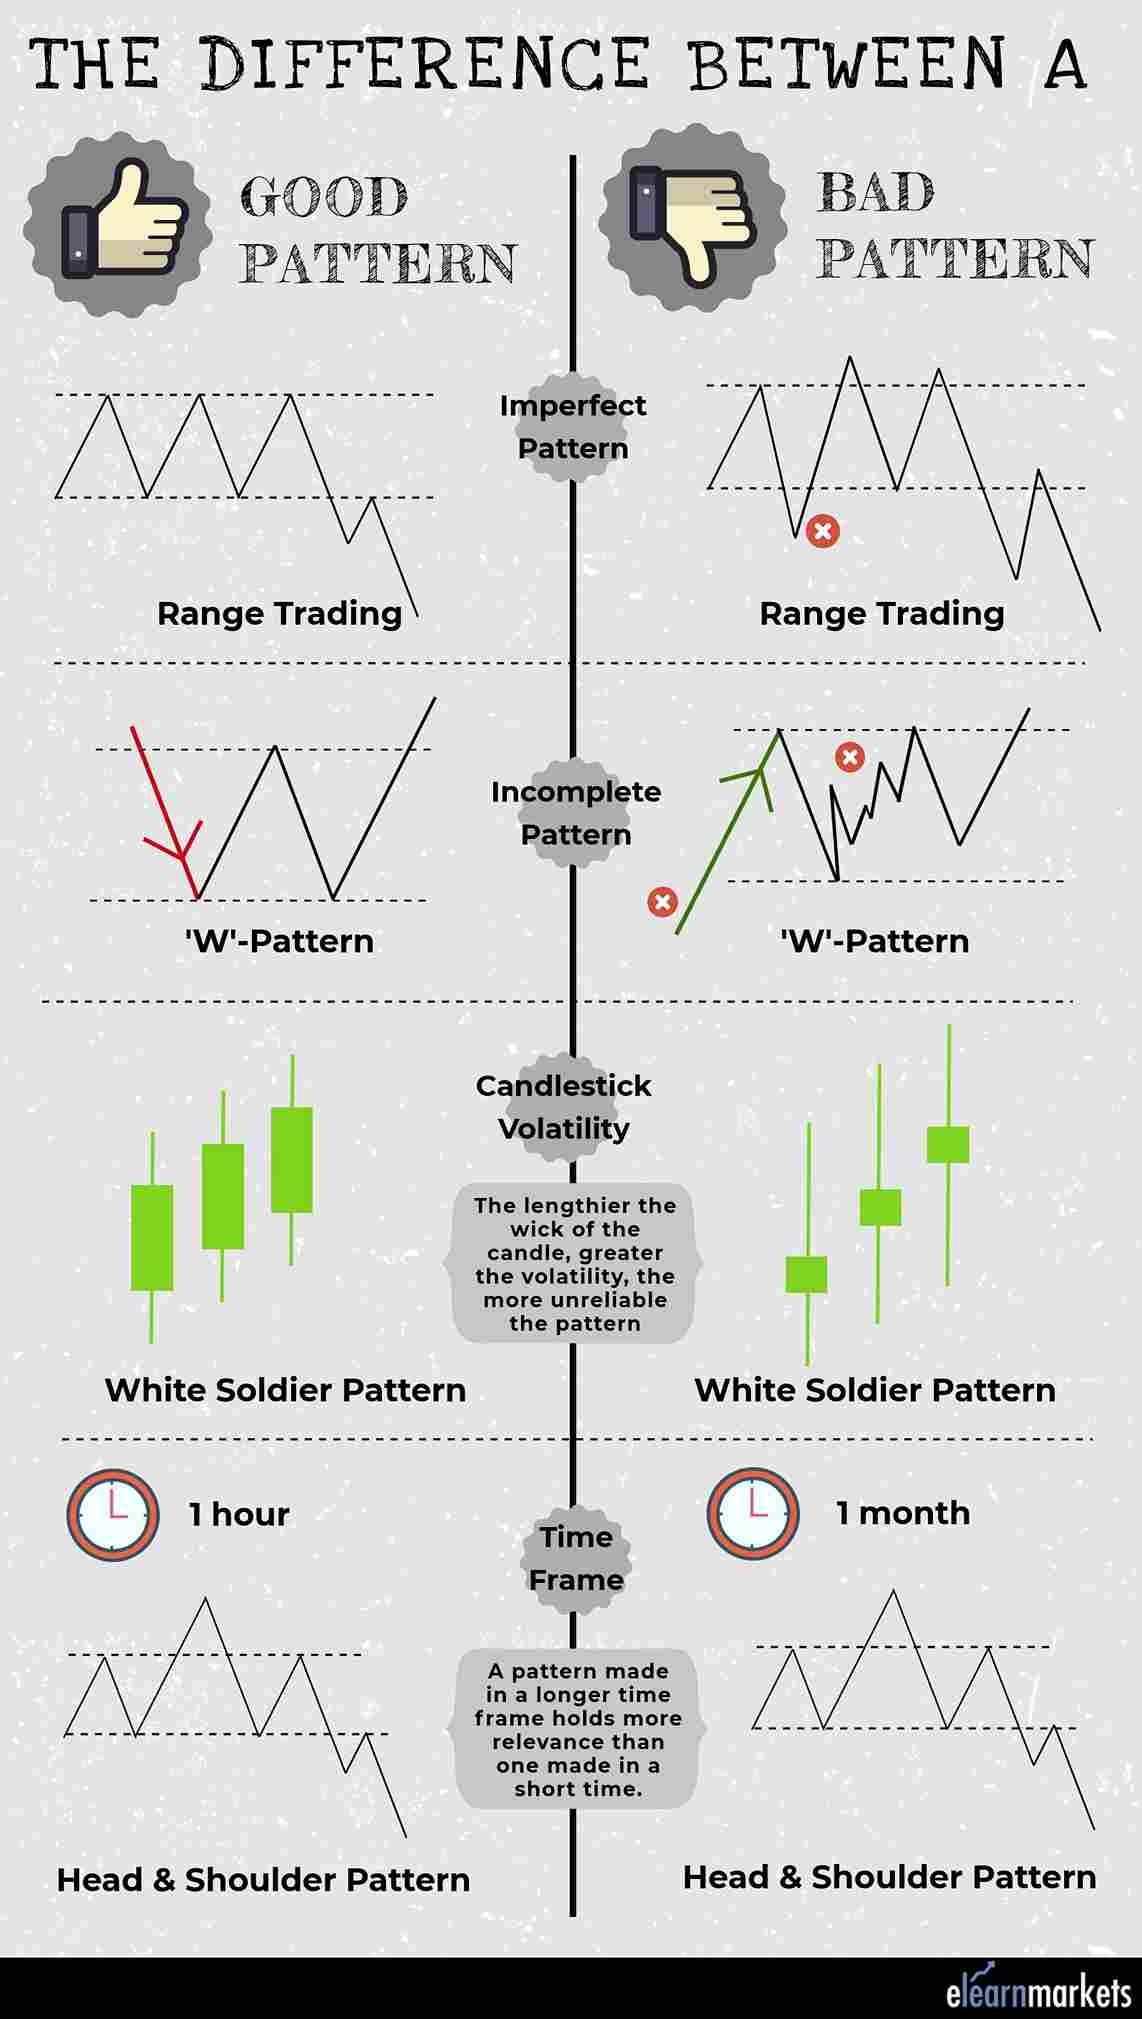
There are a number of patterns in technical analysis that are indicative of market behavior. It’s important to know which patterns you trade. There are a number of characteristics in a pattern so we must not jump to conclusions before analysis whether the pattern is good or bad. Otherwise, it can become one of the problems in technical analysis.
In a world as dynamic as that of trading, being conclusive without study and deep examination might tend to be an error of huge magnitude, thus categorizing trading patterns into good and bad, or white and black is ill-advised, as analysis of patterns is more about shining grey.
Read more about candlesticks: All you need to know about the Japanese Candlestick
3. Know which tools and indicators you use and don’t jump around
Indicators are statistical tools under technical analysis that gives buy-or-sell signals to investors. They help in ascertaining the momentum, market trends, level of volatility, and other aspects of a security. Only when they are collectively used with other technical analysis tools do they give successful returns.
There are a number of indicators that help investors make trading decisions. Some are – Stochastic, Relative Strength Index (RSI), and Moving Average Convergence Divergence (MACD). Now, how they function and help is something that either one knows or one learns. How to use them is something that is very essential for technical analysis.
Firstly, one should always prefer back-tested indicators. For instance, if the indicator (Stochastic) shows that the stock is overbought or oversold, we should not blindly estimate it’s future. Rather we should see if it exhibited a similar situation in the past and analyze what had happened then.
Secondly, we should choose an appropriate indicator to understand a specific aspect of the market. If we want to understand whether it’s overbought or sold, we shouldn’t choose ADX. That depicts market strength. Different indicators are best suited for different times. So, choosing the right indicator for the right estimation is important.
And finally, don’t select a whole lot of indicators to make your setup look fancy. Don’t depend on all of them, it’s important to know what aspect you want to study and select the indicator.
4. Avoid Hindsight Error
More often than not, fundamental data, charts, and indicators give us data that get mixed in our heads and paints a different picture of the present scenario. Investors, then, take actions according to what they think will happen. But in retrospection, they look at outcomes in the market with a ‘know-it-all’ attitude. They pretend like they ‘had a feeling’ that this would happen long before. Everything seems obvious to them in hindsight. This gives them a false sense of confidence.
A trader either becomes overconfident with respect to future trades, not realizing that it could have been a coincidence; or they experience frustration when he was unable to grab the opportunity he knew he had for sure. These feelings cause them to make irrational trading decisions that could wipe out their capital.

An investor should stick to the original trading plan, keep a record of his trades and always look objectively on past information to overcome the hindsight bias. It’s not possible to capture every trade, rather focus on the few in his domain.
For instance, in technical analysis, we see a head-and-shoulder pattern. It was also evident in NIFTY. So we plan the trade accordingly but it doesn’t work out as planned. Later we might feel that it was obvious, considering the volume, time-frame, news announcement etc. But we didn’t make our decision seeing all that. What we’re trying to say is that it seldom means that what had happened would happen again. There are a lot of variables to consider.
5. It’s a myth that entries are most important
People are often mistaken that if they make the perfect entry, they’re set on the road to profitability. They often use new technical analysis tools or mess with their old ways to do so. Well, they’re wrong. Where you make your entry has almost nothing to do with your success or failure.
Every trade goes through 6 stages, and entry is only ONE of them, so yeah it’s safe to say that entries don’t matter!
In technical analysis, every smart trade starts with planning. You need to figure out what kind of industry or market suits your style the best and then screen your options. Then before entering, it’s important to wait out for a signal. Avoiding unprofitable scenarios is more important than figuring out your entry-point. After this is done, you make sure that the signal was valid. One should cover the news, profit and stop-loss levels, risk-target and then double-check everything.
Only once you’ve done, should you pull the trigger on the entry. The job doesn’t end here. Management to evaluate the changing scenarios and taking new decisions is important. While at it, do not micro-manage. It will constantly stay on your mind and will compel you to fiddle with the trade and mess it up. This will help you understand your exit and deal with the emotional state that will tell you something else. When all this is done, it’s essential to review your actions and improve upon it to not repeat the same mistakes you did this time.
But always remember, there’s no ‘holy grail’ from the start.
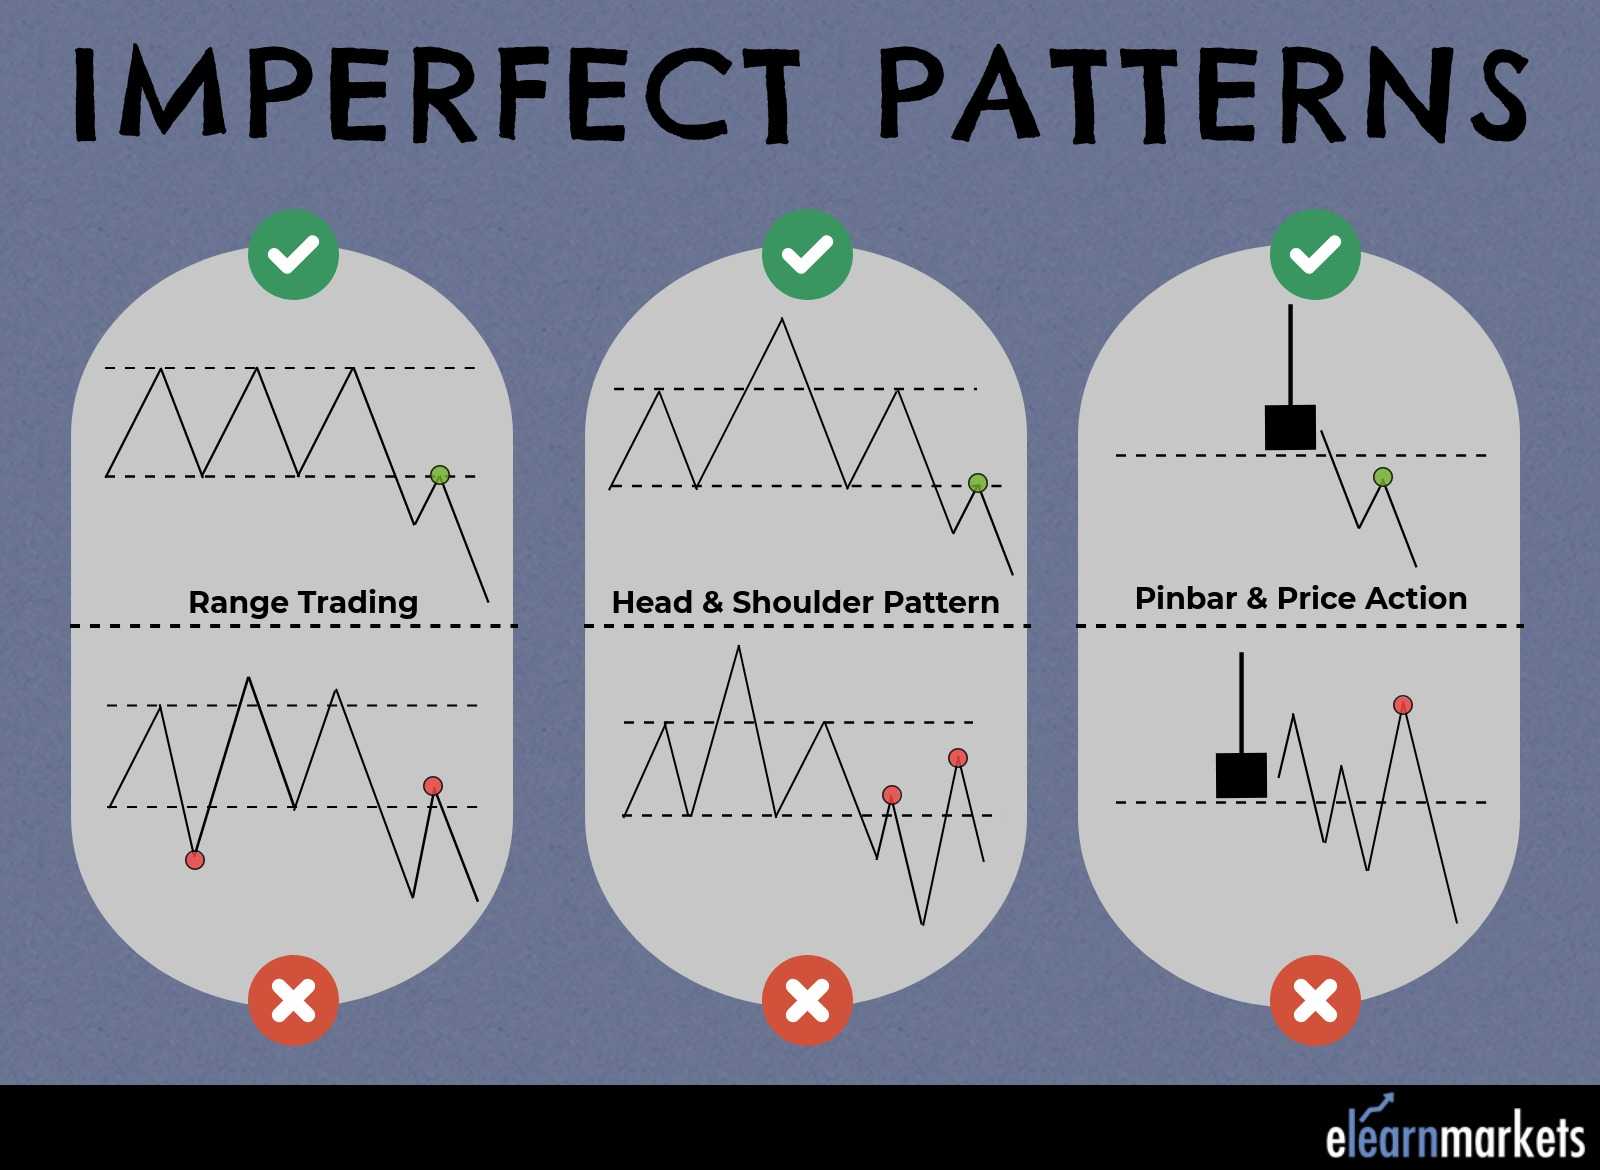
6. Imperfections in Price Patterns
Price, being a dynamic concept, can’t be 100% reliable. There will be certain ‘imperfect’ price actions that will not conform to your textbook ideas and rules in. Don’t try to force these patterns on the market. Everyone reads the same textbook, and some still fail. It’s very rare that people find these patterns in reality. We end up having unreal expectations, false assumptions, and unsuccessful trades.
We try finding patterns where they’re not. For instance, we complete the incomplete patterns in our head and assume it will go as expected. There will be an incomplete ‘W’ pattern that didn’t really touch the last highest price-point but we’re so desperate that we make it one. In a candlestick, the spikes also represent volatility and thus, confusion. We often neglect it to fuel our train of thought. We abandon the concept of time-frame and don’t care how much time that pattern took to make. In a one day chart, a significant pattern holds no importance to a long-term investor.
Try to understand, knowing patterns is important for analysis. But, technical analysis is a practical approach. We should get used to the idea of imperfection and take volatility and natural movements in stride. Forcefully finding patterns and neglecting everything that follows will get you in a fix.
7. Technical analysis is very discretionary
There are many technical analysis patterns and indicators today, but it is not possible that we should master all the patterns and indicator. We should only trade with the indicators and patterns with which we are comfortable. Using too many indicators will confuse up and it will lead us to take up a wrong decision. But we should not ignore the other indicators also. We may not use them but we should keep knowledge about them. We can need the help of those indicators while trading.
Also Read : How can I make Profit from Technical Analysis consistently?
The patterns that are formed on the trading charts are always not bookish. They are not as perfect as they are shown in the technical analysis books. But if we jump into the trade before the pattern formation is over we would make a huge loss. We should understand the imperfection of pattern. So basically we should know everything about indicators and patterns before starting trading.
Bottomline
In the world of finance, there is uncertainty, and technical analysis is a tool that helps us balance it out. It’s not easy to master it and there are lot of problems in technical analysis which one needs to overcome. There are many variables that play a role in the market scenario. Thus, we should establish some rules that will help us stay put in this world. We must know theoretically, but also practically, what cues to take and not if we want to be a success.
In the latest updates on Financial Markets visit https://stockedge.com/


wonderful informations and ideas, great.
Hi,
Thank you for Reading!
Keep Reading!
Very nice collection for beginners and language is too easy. Excellent.🌹🌹🌹🌹
Hi,
Thank you for Reading!
Keep Reading!
I regard something really interesting about your website so I saved to fav.