Elearnmarkets - Financial Market Learning
  • Courses
  • Webinars
  • Stories
  • Language
    • English
    • Hindi
    • Bengali
No Result
View All Result
Get Free Course
  • Basic Finance
  • Derivatives
    • Futures
    • Options
  • Financial Planning
  • Fundamental Analysis
  • Technical Analysis
  • Mutual Funds
  • Marketshala
  • Miscellaneous
Elearnmarkets - Learn Stock Market, trading, investing for Free
  • Courses
  • Webinars
  • Stories
  • Language
    • English
    • Hindi
    • Bengali
No Result
View All Result
Get Free Course
Elearnmarkets - Learn Stock Market, trading, investing for Free
No Result
View All Result
Home Technical Analysis
Trend Trading: Strategies and Techniques You Need to Know 1

Trend Trading: Strategies and Techniques You Need to Know

Vineet Patawari by Vineet Patawari
January 3, 2025
in Technical Analysis
Reading Time: 7 mins read
0
643
VIEWS
Share on FacebookShare on XShare on WhatsApp

Trend trading is a highly effective strategy that aligns your investments with the market’s natural direction and flow. Using careful analysis and attention to market patterns, traders can identify the possibility to enter and exit positions at the perfect times, improving their chances of profitability.

Let’s see how trend trading strategy is a great trading strategy that can be mastered using a variety of tactics and instruments.

What is Trend Trading?

The foundation of trend trading lies in the idea that markets often follow identifiable trends over time. An asset’s price moving steadily in one direction, either upward or downward, is referred to as a trend. 

Usually, the goal of trend traders is to early detect these trends and ride on them until they exhibit indications of reversing or losing strength. The main objective is to enter a trade at the very beginning of a trend, hold the position as long as the trend remains strong, and exit when the trend starts to weaken or reverse.

The simplicity and profit-making potential of trend trading are among its greatest attractions. This approach can be used in various markets and asset classes, as you can use different tools and indicators to identify entry and exit points based on the trends. 

Trend Trading Example

Let us assume that the value of a stock has been growing for a few weeks, gradually reaching higher highs and lower lows. This indicates a positive trend. 

Step 1: As a trend trader, you expect the uptrend to continue; therefore, you choose to take a long position once the stock price breaks beyond a recent high. 

Step 2: You keep holding your position while the stock price rises over time, keeping an eye on important indicators like volume or moving averages to ensure the trend continues. 

Step 3: Before the trend reverses, you choose to sell your position when you see indications of a possible reversal, such as a decline in momentum or a shift in the market environment. 

Therefore, the main objective in trend trading is to ride the wave as long as it lasts and get off before it goes away.

Different Types of Trends

Before we move forward with trend trading strategies, it is essential to understand the 3 main types of market trends: 
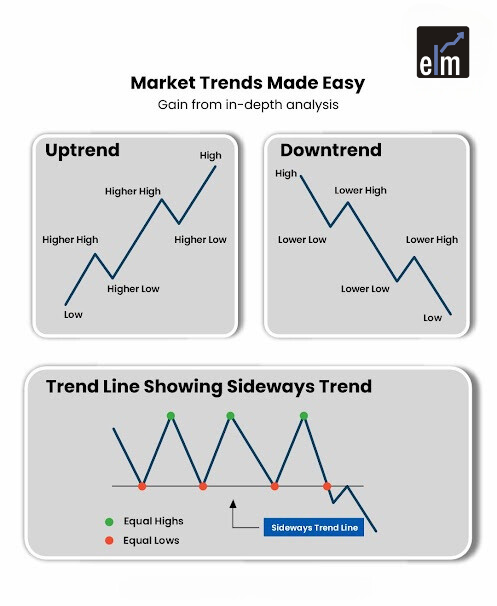
uptrend, downtrend, and sidewaytrend

Uptrend

Over time, prices consistently increase during an upward trend. On a price chart, this trend is typically indicated by higher highs and higher lows. Upward trends generally reflect strong investor confidence and positive market sentiment.

It is suggested to use trend trading indicators like momentum indicators or moving averages as confirmation signals while trading an upward trend. Ride the trend after you enter a trade until you see indications of a reversal.

Sideway Trend

When prices fluctuate within a specific range without apparent direction, this is known as a sideways trend. These patterns frequently signify periods of market hesitation or stability.

Some traders use range-trading techniques to make profits, while others avoid sideways patterns. For example, you may purchase a stock close to the support level, i.e., the lower boundary, and sell it close to the resistance level, i.e., the upper boundary.

Downtrend

A negative trend, sometimes known as a bear trend, is indicated by lower highs and lower lows, which signify a price drop. Usually, this pattern suggests negativity as traders expect more price dips. 

Here, the main goals of trend traders are to preserve long holdings or take advantage of short-selling opportunities. 

Since these levels might provide information about probable reversal points, identifying significant resistance levels becomes essential for traders looking to manage risk and plan their investments successfully.

Trend Trading Strategies

Moving Averages

The moving average is one of the most commonly utilised techniques in trend trading. They make it simpler to determine the general direction of a trend by averaging out pricing data over a specific period.

There are two types of moving averages in trend trading indicators: 

  • Simple Moving Average: The SMA determines the average price over a predetermined number of periods.
  • Exponential Moving Average: EMA makes it more reactive to fresh data by giving more importance to current prices.

Moving averages are frequently combined to validate patterns. 

A “crossover” occurs when a short-term average (such as 50 days) rises or falls over a longer-term average (such as 200 days). 

For example, it is often called a “golden cross,” indicating that prices may increase if the short-term average exceeds the long-term average. Conversely, when the short-term moving average crosses below the long-term moving average, it is called a “death cross,” which may signal potential price declines.

Momentum Indicators

With momentum indicators in trend trading, traders can estimate a trend’s strength and decide whether it will likely continue or fade away. Some of the most used momentum indicators are as follows:

  • Relative Strength Index: RSI shows if an asset is overbought or oversold by calculating the rate and direction of price changes. The RSI below 30 denotes oversold situations, while an RSI above 70 shows overbought situations.
  • Moving Average Convergence Divergence: MACD is a trend-following momentum indicator that displays the correlation between two moving averages of a stock’s price. 

In addition to price trend trading indicators, you can use momentum indicators to check if a trend is strong enough to continue or if a reversal is likely due to a loss of market momentum.

Trendlines & Chart Patterns

Trendlines are one of the most straightforward and practical methods for identifying market trends. The lowest and highest points of an uptrend or downtrend are connected to form a trendline, which helps to understand the market’s direction. 

The trendline acts as support during an uptrend, where prices typically bounce back after touching it, and as resistance during a downtrend, where prices often fail to rise above it.  

To determine the potential direction of the market, traders frequently study chart patterns such as triangles, channels, and flags in addition to trendlines. 

For example, if the price breaks out of a triangular formation, it may indicate that the trend will probably continue. Conversely, a “head and shoulders” pattern might suggest that the market is about to turn around and go from an upward to a downward trend.

Conclusion

Gaining expertise in trend trading requires perseverance, self-control, and enough resources. Finding trends is only one aspect of it; another is knowing how to use them to your advantage. With the right information and strategies, you can trade confidently and effectively in a dynamic market.With an emphasis on real-world applications, interactive learning, and practical insights on trend trading, Elearnmarkets equips you with everything needed to achieve your financial goals. Take your trading career to the next level by exploring the resources at Elearnmarkets and unlock your full trading potential today!

ShareTweetSend
Get Kotak Offer Get Kotak Offer Get Kotak Offer
Previous Post

Top 5 Valuation Ratios in the Stock Market

Next Post

Futures vs Options: What’s the Difference?

Vineet Patawari

Vineet Patawari

Vineet is the co-founder of Elearnmarkets. He assumes the role of CEO and his job is to help the team get their job done. Vineet drives the growth strategy and its execution through product innovation, product marketing and brand building. He is dedicated to building high performance teams and enjoys being actively involved in problem solving for business growth. Vineet, an IIM Indore Alumnus is also a Chartered Accountant and his interests include digital marketing, blogging on recreational mathematics, travelling and has a passion for teaching. When not at work, he loves spending time with his two lovely sons Arham & Vihaan and his wife Preeti.

Related Posts

Understand Slippage in Trading
Technical Analysis

What is Slippage in Trading? Meaning & Examples

March 28, 2025
307
Breakout trading strategies
Technical Analysis

Top 5 Breakout Trading Strategies

March 12, 2025
1.1k
5 stocks for today
Technical Analysis

5 Stocks to Buy Today That Could Beat the NIFTY in 2025!

May 5, 2025
404
Image describing What is marginal trading facility
Technical Analysis

 What is a Margin Trading Facility? Advantages & Risks

April 4, 2025
666

Leave a Reply Cancel reply

Your email address will not be published. Required fields are marked *

Disclaimer

Elearnmarkets (Kredent InfoEdge Pvt. Ltd.) is a SEBI-registered Research Analyst (RA) entity (SEBI Registration No.: INH300007493). The information provided in this article is for educational and informational purposes only and should not be considered as an offer to buy or sell any securities or investment products.

The stocks, securities, and investment instruments mentioned herein are not recommendations under SEBI (Research Analysts) Regulations, 2014. Readers are advised to conduct their own due diligence and seek independent financial advice before making any investment decisions.

Investments in securities markets are subject to market risks. Please read all related documents carefully before investing. Investing in Equity Shares,
Derivatives, Mutual Funds, or other instruments carry inherent risks, including potential loss of capital. Elearnmarkets (Kredent InfoEdge Pvt. Ltd.) does not provide any guarantee or assurance of returns on any investments. Past performance is not indicative of future performance.

Elearnmarkets Logo

Follow Us

Facebook-f X-twitter Instagram Linkedin-in Youtube Telegram

Register on Elearnmarkets

Continue your financial learning by creating your own account on Elearnmarkets.com

Register Free Account

Download App

Playstore logo
Download on app store

Categories

  • Basic Finance
  • Derivatives
  • Financial Planning
  • Fundamental Analysis
  • Technical Analysis
  • Mutual Funds
  • Miscellaneous

Popular On Elearnmarkets

  • Market Superheroes:
  • Vivek Bajaj
  • Chetan Panchamia
  • Ashish Kyal
  • Premal Parekh
  • Abhijit Paul
  • Jegan
  • Sivakumar Jayachadran
  • Jyoti Budhia
  • Vivek Gadodia
  • Vishal Mehta
  • Piyush Chaudhry
  • Santosh Pasi
  • Gomathi Shankar
  • Market Superheroes:
  • Vivek Bajaj
  • Chetan Panchamia
  • Ashish Kyal
  • Premal Parekh
  • Abhijit Paul
  • Jegan
  • Sivakumar Jayachadran
  • Jyoti Budhia
  • Vivek Gadodia
  • Vishal Mehta
  • Piyush Chaudhry
  • Santosh Pasi
  • Gomathi Shankar
  • Courses:​
  • Options Trading
  • Dow Theory
  • Momentum Trading
  • Stock Investing
  • Harmonic Chart Patterns
  • Algo Trading
  • Elliot Wave Theory
  • Advanced Excel
  • Cryptocurrency
  • NSE Certification Course
  • Courses:​
  • Options Trading
  • Dow Theory
  • Momentum Trading
  • Stock Investing
  • Harmonic Chart Patterns
  • Algo Trading
  • Elliot Wave Theory
  • Advanced Excel
  • Cryptocurrency
  • NSE Certification Course
  • Webinars:
  • Bank Nifty Scalping
  • Intraday Trading Strategies
  • Options Trading Strategies
  • Options selling
  • Price Action
  • Relative Strength
  • Tax Planning
  • Options Buying
  • Growth Stocks
  • Portfolio Management
  • Risk Management
  • Renko Charts
  • Crude Oil
  • Traders Psychology
  • Moving Average
  • Multibagger Stocks
  • Free Learning Modules:
  • Intraday Trading
  • Options Scalping
  • Swing Trading
  • Financial Modelling
  • RSI Indicator
  • Bollinger Bands
  • Pricing of Futures
  • Personal Finance
  • Initial Public Offerings (IPO)
  • Value Investing
  • Technical Indicators
  • Candlesticks
  • Chart Patterns
  • Option Greeks
  • ELSS Funds
  • Banking and Insurance
  • Real Estate
  • Gold
  • Book Summaries:
  • Rich Dad Poor Dad
  • Psychology of Money
  • The Intelligent Investor
  • The Richest Man in Babylon
  • Think and Trade Like a Champion
  • Value Investing and Behavioural Finance
  • Trading in the Zone
  • Learn to Earn
  • Book Summaries:
  • Rich Dad Poor Dad
  • Psychology of Money
  • The Intelligent Investor
  • The Richest Man in Babylon
  • Think and Trade Like a Champion
  • Value Investing and Behavioural Finance
  • Trading in the Zone
  • Learn to Earn
  • Tools:
  • CAGR Calculator
  • SIP Calculator
  • eLearnOptions
  • Future Value Calculator
  • Present Value Calculator
  • Atal Pension Yojana
  • Cost of Delay Calculator
  • Become a Crorepati
  • Tools:
  • CAGR Calculator
  • SIP Calculator
  • eLearnOptions
  • Future Value Calculator
  • Present Value Calculator
  • Atal Pension Yojana
  • Cost of Delay Calculator
  • Become a Crorepati

© 2025 Elearnmarkets. All Rights Reserved

  • Visit Elearnmarkets
  • Courses
  • Webinars
  • Financial Guides
  • Get Free Counselling
  • Visit Elearnmarkets
  • Courses
  • Webinars
  • Financial Guides
  • Get Free Counselling

Download Our App

No Result
View All Result
  • Article Categories
    • Basic Finance
    • Derivatives
    • Financial Planning
    • Fundamental Analysis
    • Technical Analysis
    • ETFs & Mutual Funds
    • Marketshala
    • Miscellaneous
  • Language
    • Hindi
    • Bengali
    • English
  • Courses
  • Webinars
  • Stories
Get Free Course

© 2024 Elearnmarkets All Rights Reserved

A Handbook of Technical Analysis
To start your trading journey as a seasoned technical analyst
Download Guide For FREE
Trading Mentorship Program