Nifty close 10265.7: Nifty witnessed strong rally in last two trading session and enters the bullish zone. However, the exit poll result on evening of 14th December would be a key trigger for market in the coming days.
As mentioned in last week Nifty report (mentioned in daily technical), Nifty once again reverses from 100 DMA and gave strong reversal on the upside.
Hourly Technical:
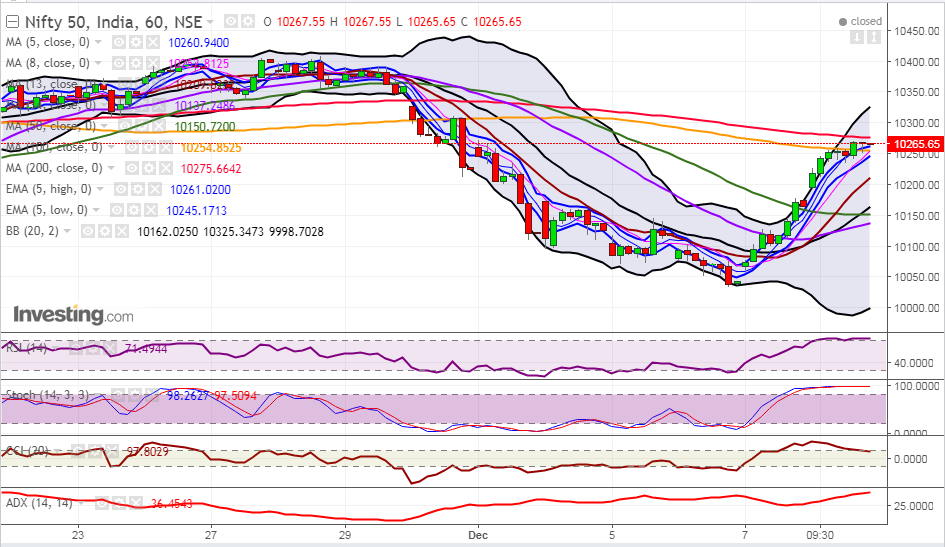
In the hourly chart, Nifty is standing just below 200 Hourly Moving average (presently at approx. 10275.7) which is a strong resistance area in the near term and the index may witness mild correction or consolidation before it resumes its upward journey.
The probable support in the hourly chart comes at 100 Hour moving average (presently at approx.10254.9) and 13 Hour moving average (presently at approx. 10209.8).
On the upside, Nifty may face resistance at 200 Hour moving average (presently at approx.10275.7) and upper Bollinger line (presently at approx. 10325.3).
Hourly Stochastic and RSI are in the overbought zone while CCI is very close to the upper bound. Moreover, the ADX is upward sloping indicating strong momentum in the hourly chart. Overall, Nifty remained bullish to neutral in the Hourly chart.
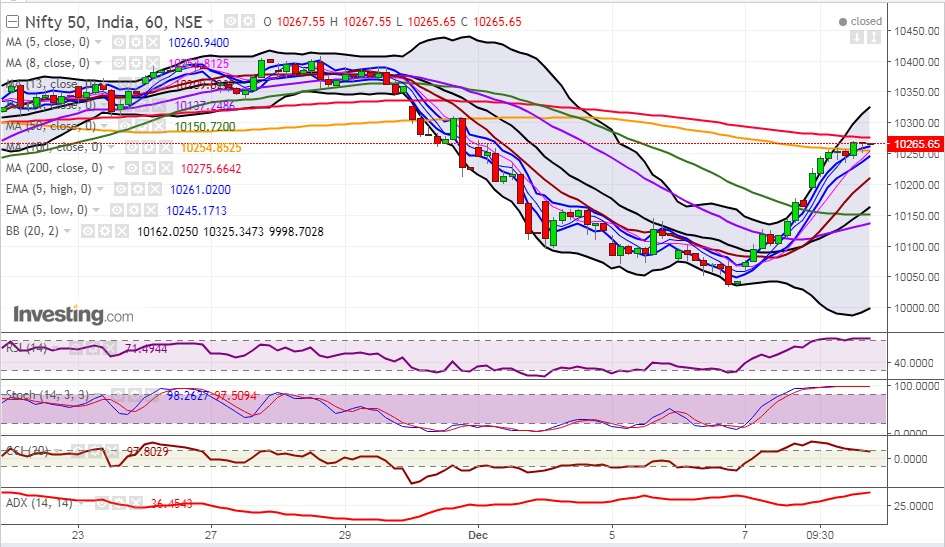
Figure: Nifty Hourly Chart
Daily Technical:
In the daily chart, Nifty crosses 5 Day High EMA (presently at approx. 10217.2) and 20 DMA (presently at approx. 10246.8) and enters the positive territory once again. , Nifty may take support from 20 DMA (presently at approx. 10246.8), 5 Day High EMA (presently at approx. 10217.2) and 5 DMA (presently at approx.10206.4).
On the upside, Nifty may face resistance at 34 DMA (presently at approx. 10289.9) and Upper Bollinger line (presently at approx. 10455.8).
Stochastic, RSI and CCI are in the normal zone. Overall Nifty remains bullish to neutral in the daily chart.
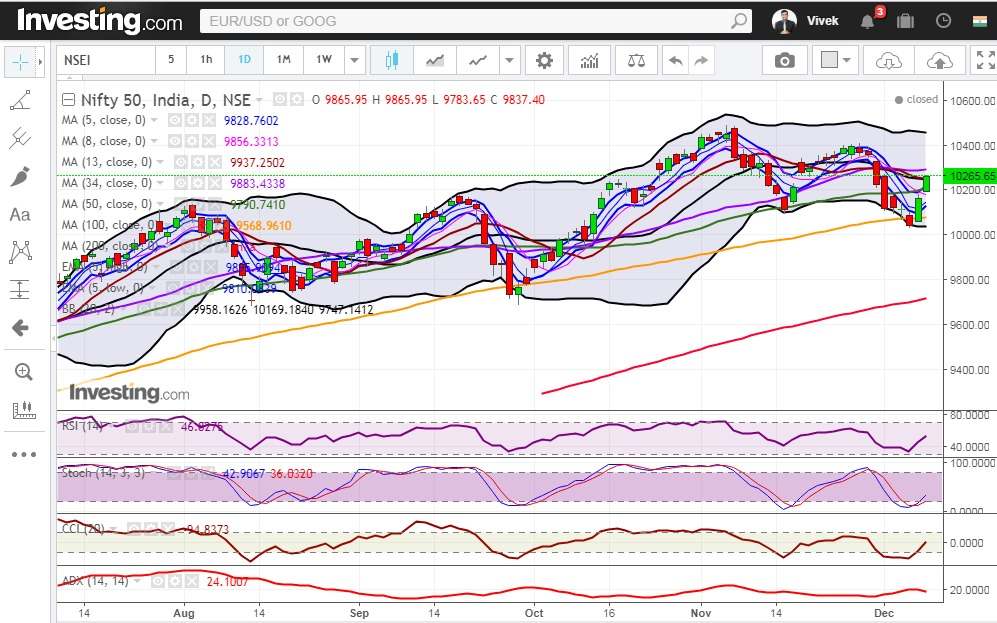
Figure: Nifty Daily Chart
Weekly Technical:
The bounce of RSI from 55 area suggests that the bulls are very much in control and it was a mere correction in the weekly time frame. Moreover Nifty closes above 20 Week moving average and enters the 5 week High-Low band which another positive trigger for Nifty in the weekly chart.
Weekly Stochastic, RSI and CCI are in the normal zone but very close to the upper bound suggesting bullish to neutral view in the weekly timeframe.
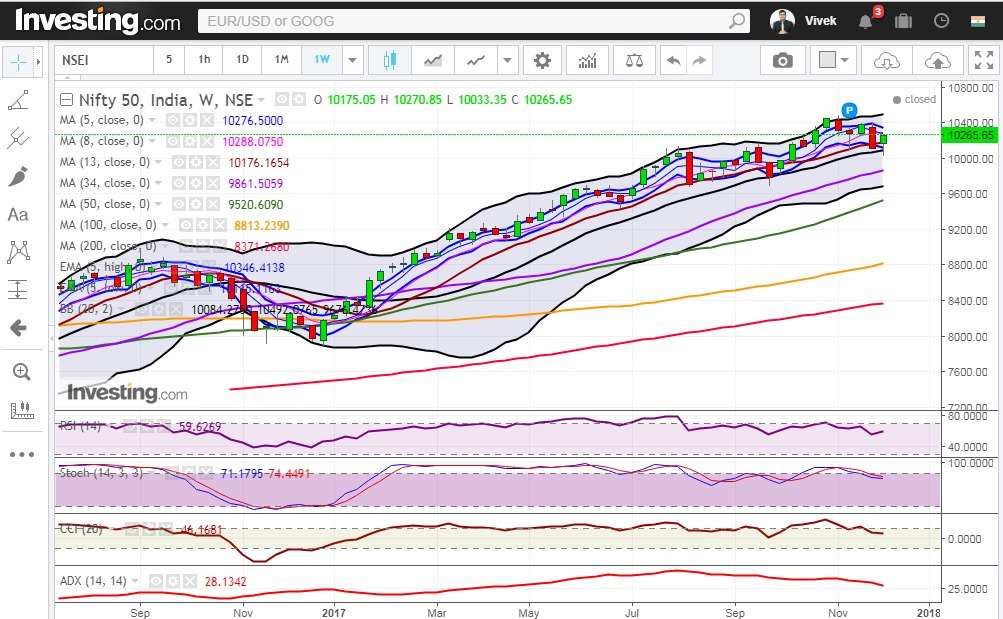
Figure: Nifty Weekly Chart
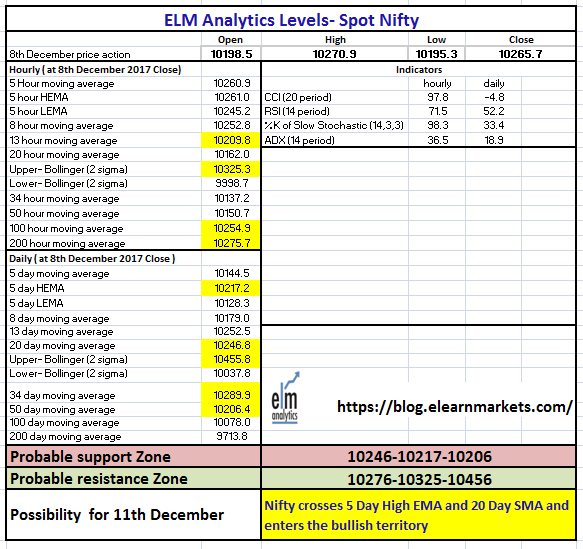
Figure: Nifty Tech Table
