Nifty close 10121.8: Nifty witnessed strong selling pressure near the November expiry. The Gujarat election is an important event to watch out for in the month of December.
Hourly Technical:
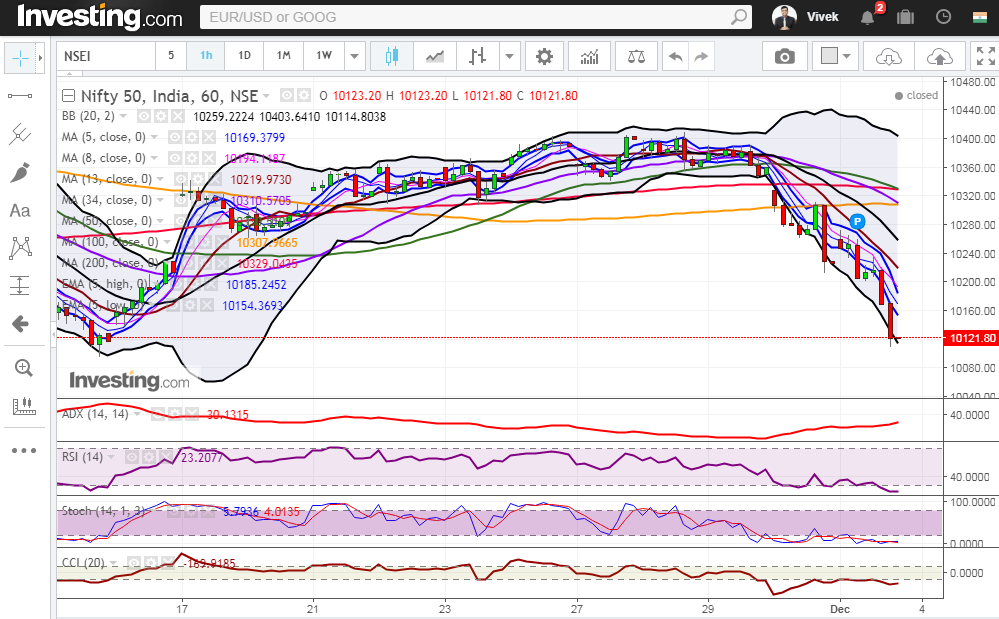
In the hourly chart, Nifty opened marginally higher but the correction continued throughout on Friday’s session. The selloff got more aggressive in the second half on Friday’s session. The probable support in the hourly chart comes at Lower Bollinger Line (presently at approx.10114.8).
On the upside, Nifty may face resistance at 5 Hour Low EMA (presently at approx.10154.4), 5 Hour moving average (presently at approx. 10169.4) and 8 Hour moving average (presently at approx. 10194.1).
Hourly CCI, Stochastic and RSI are in the oversold zone. Moreover, the ADX is upward sloping indicating intense selling pressure in the hourly chart. Overall, Nifty remained bearish in the Hourly chart.
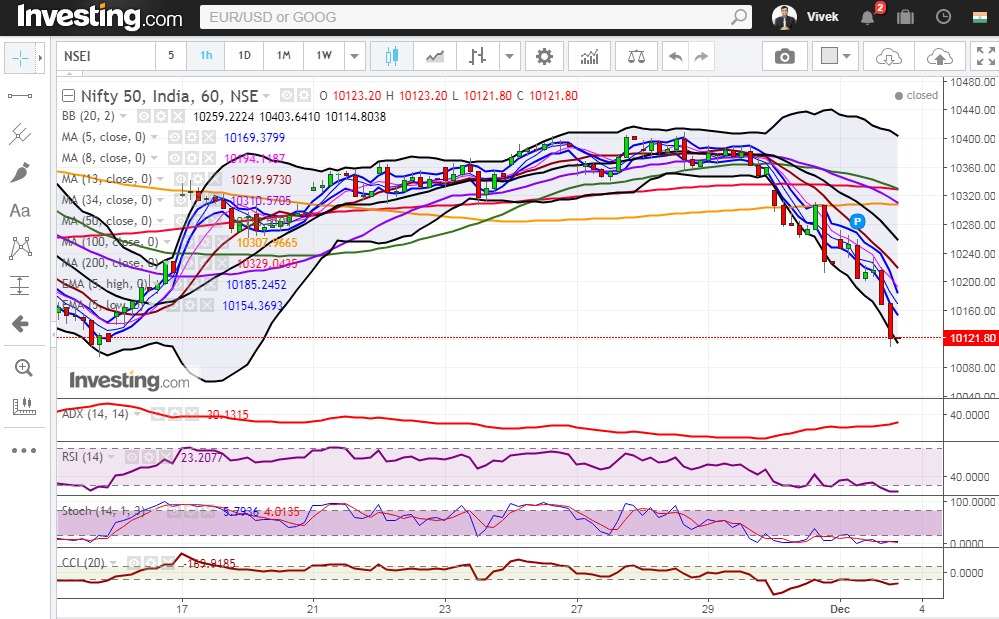
Figure: Hourly Chart
Daily Technical:
In the daily chart, Nifty broke out of the 5 Day Low EMA (presently at approx. 10233.2) suggesting weakness in the daily chart. However, Nifty may take support from 100 DMA (presently at approx. 10063.8) which is an important level for market in the coming days.
On the upside, Nifty may face resistance at 50 DMA (presently at approx. 10183.3).
Stochastic and RSI are in the normal zone but very close to the lower bound and CCI is in the oversold zone. Moreover, ADX has also turned up suggesting gain of downside momentum. Overall Nifty remains bearish to neutral in the daily chart.
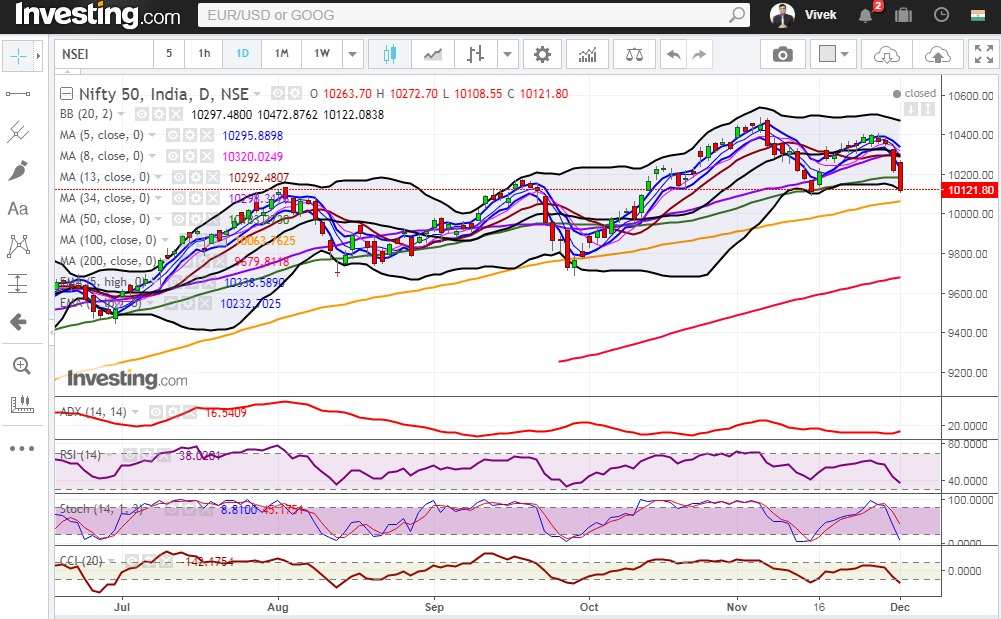
Figure: Daily Chart
Weekly Technical:
The benchmark indices Nifty is standing at a very crucial support in the weekly chart and there is a possibility of bounce back in the coming week.
Weekly Stochastic, RSI and CCI have come out of the overbought zone and entered the normal zone. Moreover, ADX is downward sloping indicating decrease in momentum. Overall Nifty remains neutral in the weekly chart.
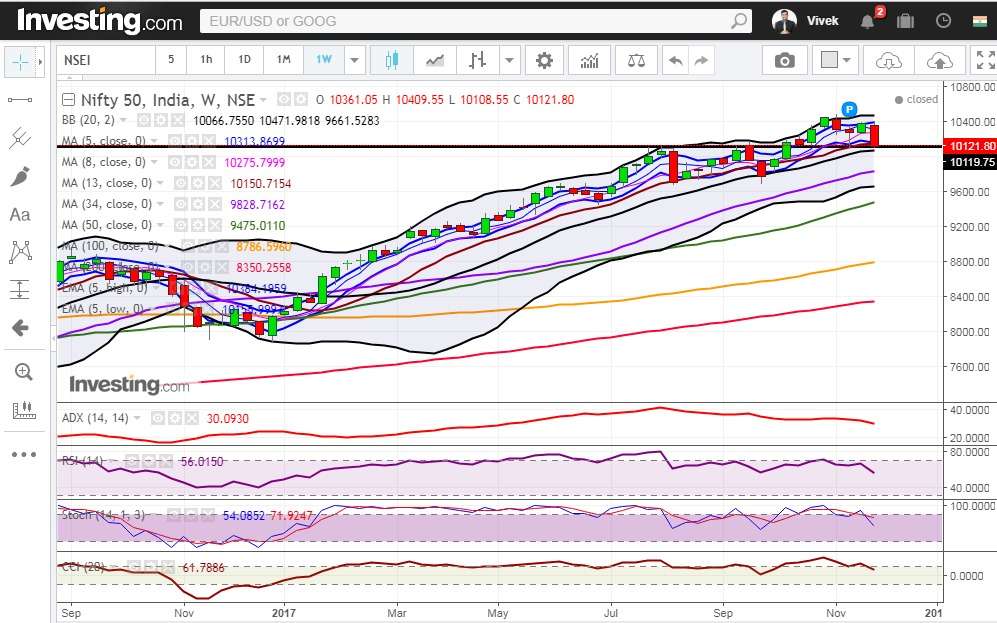
Figure: Weekly Chart
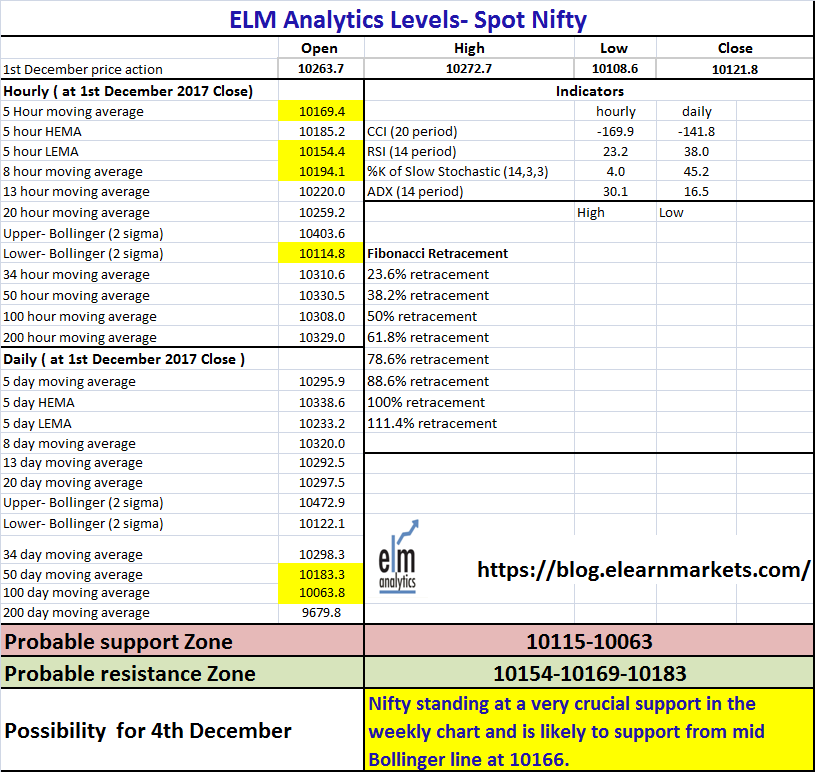
Figure: Tech Table
