Elearnmarkets - Financial Market Learning
  • Courses
  • Webinars
  • Stories
  • Language
    • English
    • Hindi
    • Bengali
No Result
View All Result
Get Free Course
  • Basic Finance
  • Derivatives
    • Futures
    • Options
  • Financial Planning
  • Fundamental Analysis
  • Technical Analysis
  • Mutual Funds
  • Marketshala
  • Miscellaneous
Elearnmarkets - Learn Stock Market, trading, investing for Free
  • Courses
  • Webinars
  • Stories
  • Language
    • English
    • Hindi
    • Bengali
No Result
View All Result
Get Free Course
Elearnmarkets - Learn Stock Market, trading, investing for Free
No Result
View All Result
Home Technical Analysis Market Analysis
Bank Nifty Hourly Chart

Global Uncertainties Trigger Sell Off In Bank Nifty

Elearnmarkets by Elearnmarkets
August 1, 2024
in Market Analysis, Market Wrap, Miscellaneous
Reading Time: 3 mins read
0
46
VIEWS
Share on FacebookShare on XShare on WhatsApp

Bank Nifty opened above its 5 Day Low EMA (24659 approx)on the 22nd September.

The Index fell by 369 points and closed below its 34 DMA (24369 approx).
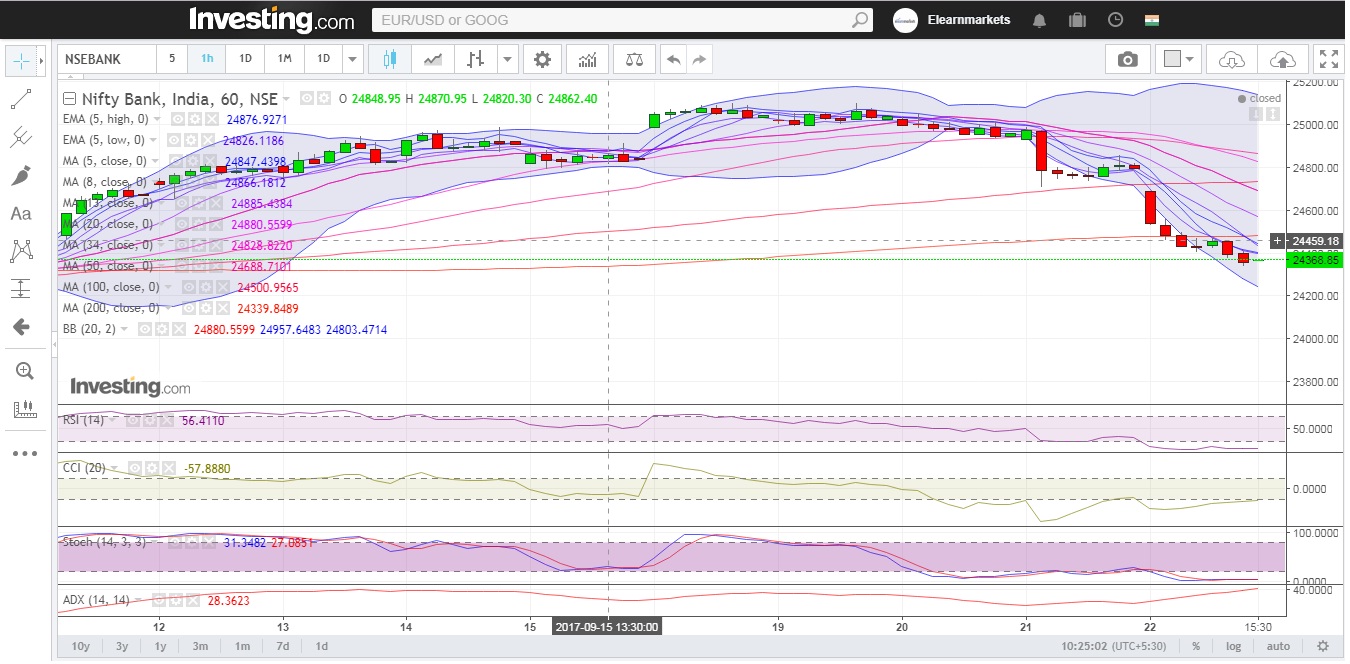
Hourly Technicals:

In the Hourly Chart, Bank Nifty has closed below its 5 hourly low EMA of (24398 approx).

The Index is likely to face multiple resistance above the 5DMA (24403 approx) mark.

If Bank Nifty breaks and closes below the lower end of the Bollinger band( 24244 approx), the next support area will be 23840.

Hourly RSI stands below the normal range. CCI, however, shows that sentiments might are highly negative.

The ADX is indicating that volatility is on the cards.

Global Uncertainties Trigger Sell Off In Bank Nifty 1

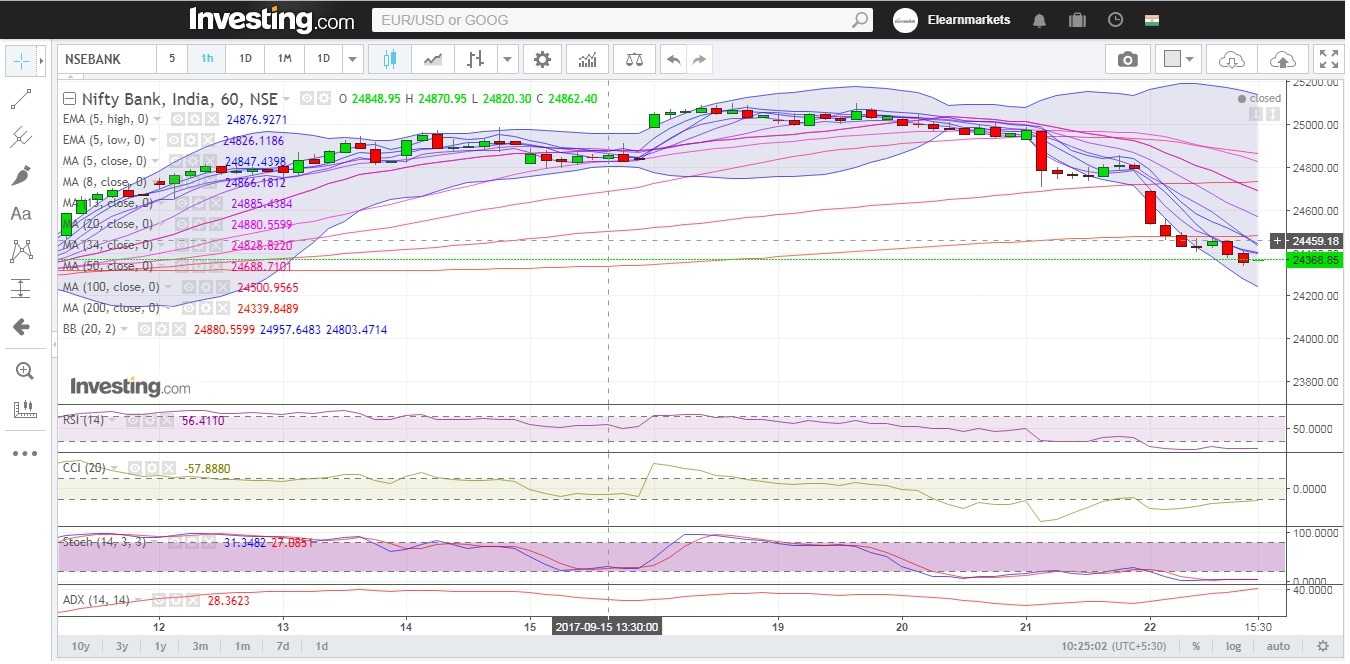
Figure: Bank-Nifty Hourly Chart

Daily Technicals:

The daily chart indicates that Bank Nifty has closed below its 34 DMA of (24369 approx).

The Index has broken below its 50DMA mark, the next support area will be around the 100 DMA mark(23840 approx).

On the downside, however , Bank Nifty has to fall by 528 points before it finds the next support zone.

The daily RSI has closed midway between the normal range.

The CCI, however, has fallen below the normal range.

The ADX indicates that momentum might be picking up.

Learn Technical Analysis in NSE Academy Certified Technical Analysis course.

Bank Nifty Daily technical showing RSI has closed between the normal range, CCI has fallen below the normal range and ADX indicating momentum might picking up

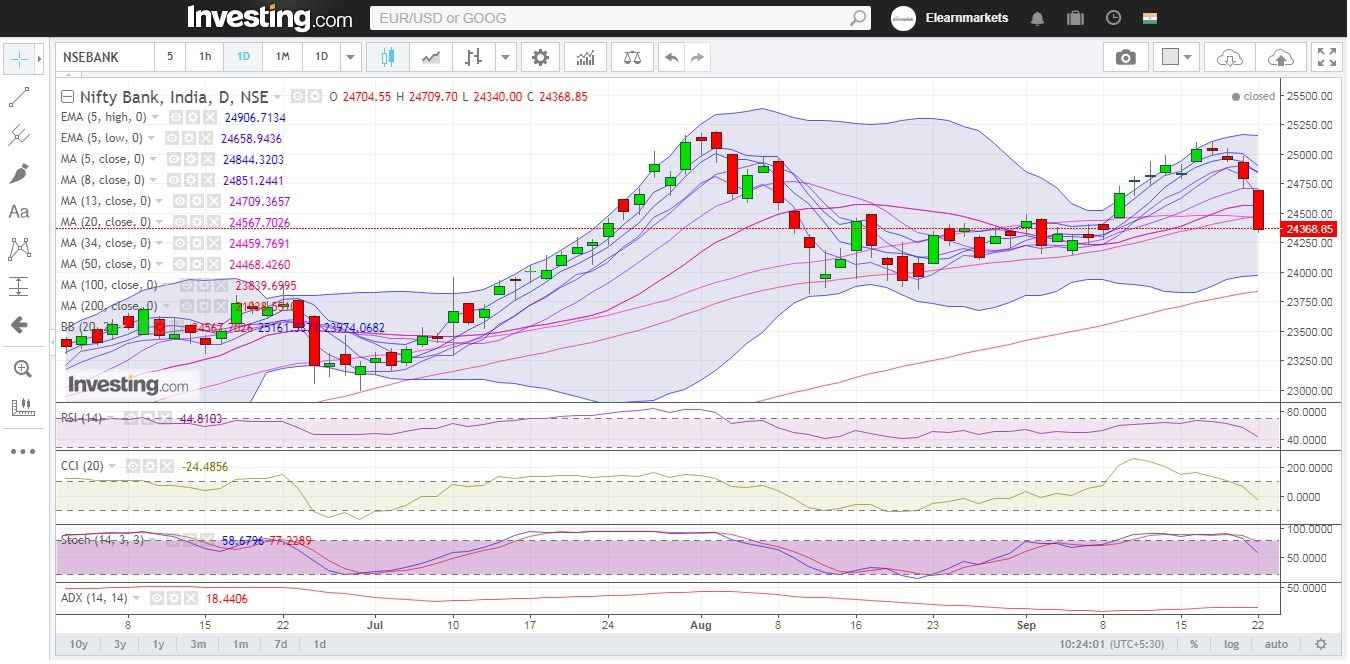
Figure: Bank-Nifty Daily Chart

Weekly Technicals:

In the Weekly Chart, Bank Nifty has closed below its 8 weekly MA of (24397 approx).

The Index is likely to face immediate resistance around is 5 weekly MA (24458 approx) mark.

If Bank Nifty breaks below its 13-week moving average (24219 approx), the next support area will be around the 20-week moving average(23888 approx).

Weekly RSI and CCI stand at the higher end of the normal range.

The ADX is indicating that volatility is on the cards.

Weekly RSI and CCI stand at the higher end of the normal range.

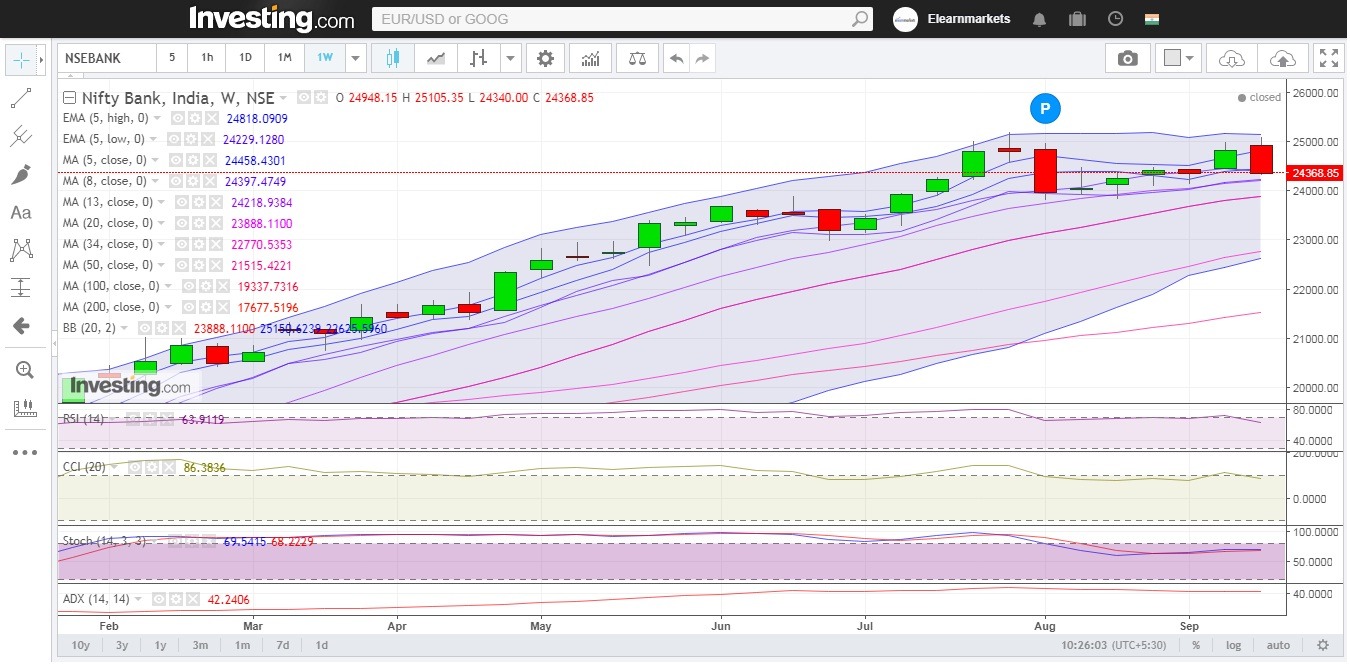
Figure: Bank-Nifty Weekly Chart

Bank-Nifty Tech Table


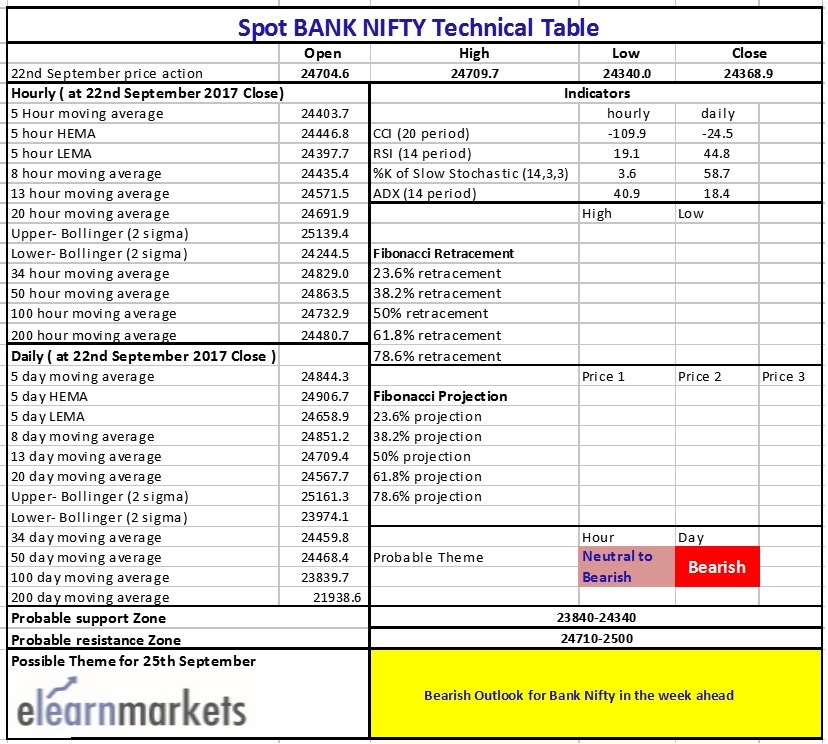
Figure: Bank-Nifty Tech Table

Watch the video below to know  how to analyze the above table:

Tags: english
ShareTweetSend
Get Kotak Offer Get Kotak Offer Get Kotak Offer
Previous Post

Nifty Below 10k, North Korea Threat Drags

Next Post

Fiscal Woes Drags Nifty Below 9900; Trims Loses In The Second Half

Elearnmarkets

Elearnmarkets

Elearnmarkets (ELM) is a complete financial market portal where the market experts have taken the onus to spread financial education. ELM constantly experiments with new education methodologies and technologies to make financial education effective, affordable and accessible to all. You can connect with us on Twitter @elearnmarkets.

Related Posts

Forex vs Stocks
Miscellaneous

Forex vs Stocks: Which Market Should You Trade First

May 13, 2025
107
Elearnmarkets's official social media handles
Miscellaneous

Official Social Media Handles of Eleanrmarkets

January 20, 2025
111
Best Personal loan Rates
Miscellaneous

5 Strategies for Finding the Best Personal Loan Rates

May 5, 2025
282
2008 Global Financial Crisis
Miscellaneous

The 2008 Global Financial Crisis

November 11, 2024
751

Leave a Reply Cancel reply

Your email address will not be published. Required fields are marked *

Disclaimer

Elearnmarkets (Kredent InfoEdge Pvt. Ltd.) is a SEBI-registered Research Analyst (RA) entity (SEBI Registration No.: INH300007493). The information provided in this article is for educational and informational purposes only and should not be considered as an offer to buy or sell any securities or investment products.

The stocks, securities, and investment instruments mentioned herein are not recommendations under SEBI (Research Analysts) Regulations, 2014. Readers are advised to conduct their own due diligence and seek independent financial advice before making any investment decisions.

Investments in securities markets are subject to market risks. Please read all related documents carefully before investing. Investing in Equity Shares,
Derivatives, Mutual Funds, or other instruments carry inherent risks, including potential loss of capital. Elearnmarkets (Kredent InfoEdge Pvt. Ltd.) does not provide any guarantee or assurance of returns on any investments. Past performance is not indicative of future performance.

Elearnmarkets Logo

Follow Us

Facebook-f X-twitter Instagram Linkedin-in Youtube Telegram

Register on Elearnmarkets

Continue your financial learning by creating your own account on Elearnmarkets.com

Register Free Account

Download App

Playstore logo
Download on app store

Categories

  • Basic Finance
  • Derivatives
  • Financial Planning
  • Fundamental Analysis
  • Technical Analysis
  • Mutual Funds
  • Miscellaneous

Popular On Elearnmarkets

  • Market Superheroes:
  • Vivek Bajaj
  • Chetan Panchamia
  • Ashish Kyal
  • Premal Parekh
  • Abhijit Paul
  • Jegan
  • Sivakumar Jayachadran
  • Jyoti Budhia
  • Vivek Gadodia
  • Vishal Mehta
  • Piyush Chaudhry
  • Santosh Pasi
  • Gomathi Shankar
  • Market Superheroes:
  • Vivek Bajaj
  • Chetan Panchamia
  • Ashish Kyal
  • Premal Parekh
  • Abhijit Paul
  • Jegan
  • Sivakumar Jayachadran
  • Jyoti Budhia
  • Vivek Gadodia
  • Vishal Mehta
  • Piyush Chaudhry
  • Santosh Pasi
  • Gomathi Shankar
  • Courses:​
  • Options Trading
  • Dow Theory
  • Momentum Trading
  • Stock Investing
  • Harmonic Chart Patterns
  • Algo Trading
  • Elliot Wave Theory
  • Advanced Excel
  • Cryptocurrency
  • NSE Certification Course
  • Courses:​
  • Options Trading
  • Dow Theory
  • Momentum Trading
  • Stock Investing
  • Harmonic Chart Patterns
  • Algo Trading
  • Elliot Wave Theory
  • Advanced Excel
  • Cryptocurrency
  • NSE Certification Course
  • Webinars:
  • Bank Nifty Scalping
  • Intraday Trading Strategies
  • Options Trading Strategies
  • Options selling
  • Price Action
  • Relative Strength
  • Tax Planning
  • Options Buying
  • Growth Stocks
  • Portfolio Management
  • Risk Management
  • Renko Charts
  • Crude Oil
  • Traders Psychology
  • Moving Average
  • Multibagger Stocks
  • Free Learning Modules:
  • Intraday Trading
  • Options Scalping
  • Swing Trading
  • Financial Modelling
  • RSI Indicator
  • Bollinger Bands
  • Pricing of Futures
  • Personal Finance
  • Initial Public Offerings (IPO)
  • Value Investing
  • Technical Indicators
  • Candlesticks
  • Chart Patterns
  • Option Greeks
  • ELSS Funds
  • Banking and Insurance
  • Real Estate
  • Gold
  • Book Summaries:
  • Rich Dad Poor Dad
  • Psychology of Money
  • The Intelligent Investor
  • The Richest Man in Babylon
  • Think and Trade Like a Champion
  • Value Investing and Behavioural Finance
  • Trading in the Zone
  • Learn to Earn
  • Book Summaries:
  • Rich Dad Poor Dad
  • Psychology of Money
  • The Intelligent Investor
  • The Richest Man in Babylon
  • Think and Trade Like a Champion
  • Value Investing and Behavioural Finance
  • Trading in the Zone
  • Learn to Earn
  • Tools:
  • CAGR Calculator
  • SIP Calculator
  • eLearnOptions
  • Future Value Calculator
  • Present Value Calculator
  • Atal Pension Yojana
  • Cost of Delay Calculator
  • Become a Crorepati
  • Tools:
  • CAGR Calculator
  • SIP Calculator
  • eLearnOptions
  • Future Value Calculator
  • Present Value Calculator
  • Atal Pension Yojana
  • Cost of Delay Calculator
  • Become a Crorepati

© 2025 Elearnmarkets. All Rights Reserved

  • Visit Elearnmarkets
  • Courses
  • Webinars
  • Financial Guides
  • Get Free Counselling
  • Visit Elearnmarkets
  • Courses
  • Webinars
  • Financial Guides
  • Get Free Counselling

Download Our App

No Result
View All Result
  • Article Categories
    • Basic Finance
    • Derivatives
    • Financial Planning
    • Fundamental Analysis
    • Technical Analysis
    • ETFs & Mutual Funds
    • Marketshala
    • Miscellaneous
  • Language
    • Hindi
    • Bengali
    • English
  • Courses
  • Webinars
  • Stories
Get Free Course

© 2024 Elearnmarkets All Rights Reserved

Guide Book on Investing with ₹ 5000
Learn about the Basics of Investments and Finance in this Ebook.
Download Guide For FREE
Trading Mentorship Program