Nifty (Close 10006.1): Nifty breaks the previous resistance of 9963 and also the symmetrical triangle with a gap which suggests that the bulls are back in control.
Hourly Technical
In the Hourly chart, Nifty has closed above most short-term moving averages.
The short-term resistance in the Hourly chart as per last day at approx. 9963 was broken by Nifty today with a gap
. The probable support in the hourly chart comes at 13 Hour Moving Average (presently at approx. 9974.6), 20 Hour Moving Average (presently at approx.9962) and 34 Hour Moving Average (presently at approx.9947.3).
On the upside, Nifty may face resistance at Upper Bollinger Line (presently at approx. 10033.5).
Hourly CCI, RSI are very close to the upper bound of the normal zone and Stochastic is still in the overbought zone.
However, ADX has again started rising indicating gain in upside momentum.
Overall Nifty remains Bullish in the hourly timeframe.
Become a technical analysis expert by joining: NSE Academy Certified Technical Analysis course.
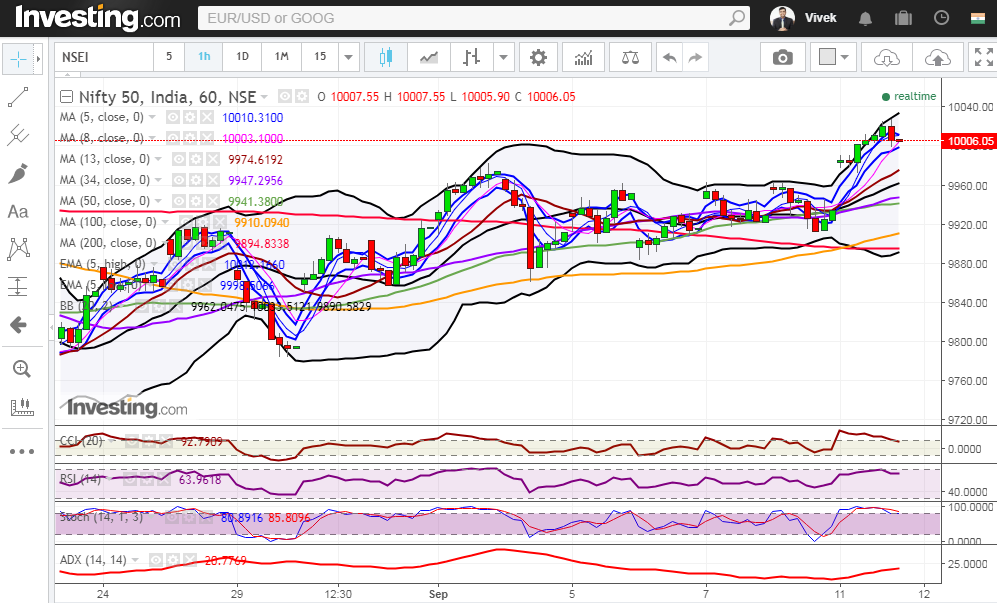
Figure: Hourly Chart
Daily Technical
In the Daily chart, Nifty has taken breakout from the symmetrical triangle with a gap and has also closed above 5 Day High EMA which is very positive.
The probable support in the Daily chart comes at 5 Day High EMA (presently at approx.9980.3) and 8 DMA (presently at approx.9943).
On the upside, Nifty may face resistance at Upper Bollinger Line (presently at approx. 10027.8).
Daily Stochastic and CCI are in the overbought zone and RSI is close to the upper bound of the normal zone. Overall Nifty remains Bullish in the Daily timeframe.
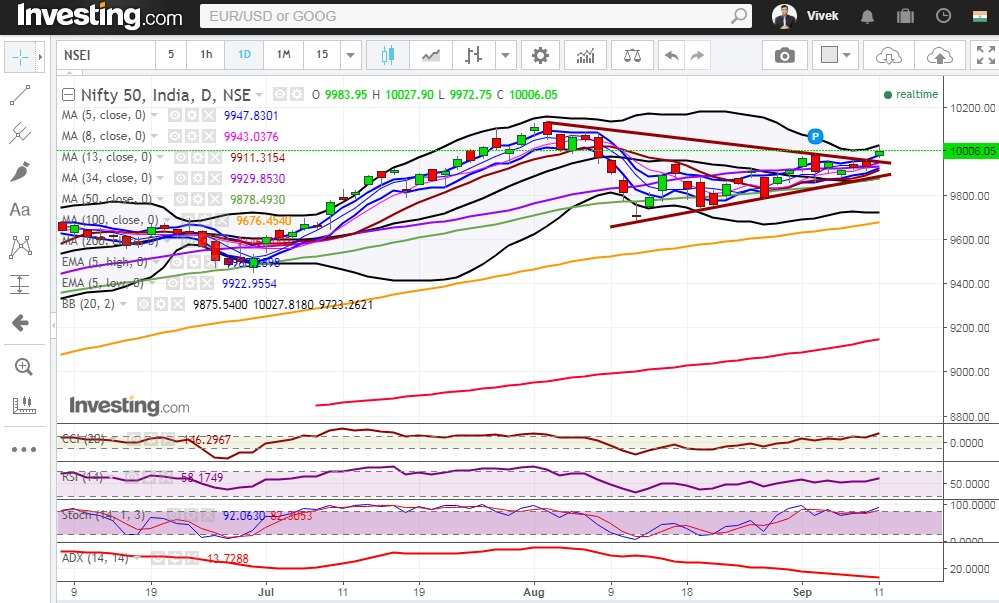
Figure: Daily Chart
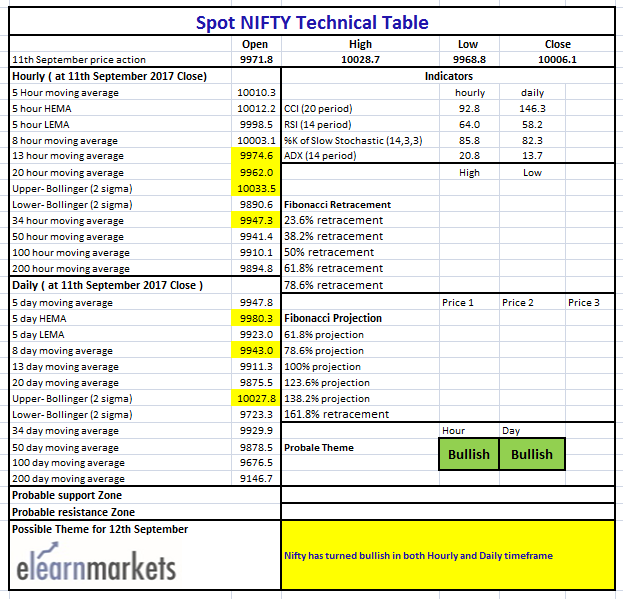
Figure: Tech Table
Watch the video below to interpret the above table:


