Elearnmarkets - Financial Market Learning
  • Courses
  • Webinars
  • Stories
  • Language
    • English
    • Hindi
    • Bengali
No Result
View All Result
Get Free Course
  • Basic Finance
  • Derivatives
    • Futures
    • Options
  • Financial Planning
  • Fundamental Analysis
  • Technical Analysis
  • Mutual Funds
  • Marketshala
  • Miscellaneous
Elearnmarkets - Learn Stock Market, trading, investing for Free
  • Courses
  • Webinars
  • Stories
  • Language
    • English
    • Hindi
    • Bengali
No Result
View All Result
Get Free Course
Elearnmarkets - Learn Stock Market, trading, investing for Free
No Result
View All Result
Home Technical Analysis Market Analysis
Bank Nifty Hourly Chart

Bank Nifty Survived Korean Jitters In the September Series

Elearnmarkets by Elearnmarkets
August 1, 2024
in Market Analysis, Market Wrap, Miscellaneous
Reading Time: 2 mins read
0
52
VIEWS
Share on FacebookShare on XShare on WhatsApp

Bank Nifty opened above its 5 Day High EMA (24417 approx) today the 8th of September. The Index traded in a range of 140 points throughout the day and closed below the 5 day high EMA of (24401 approx)

Hourly Technicals:
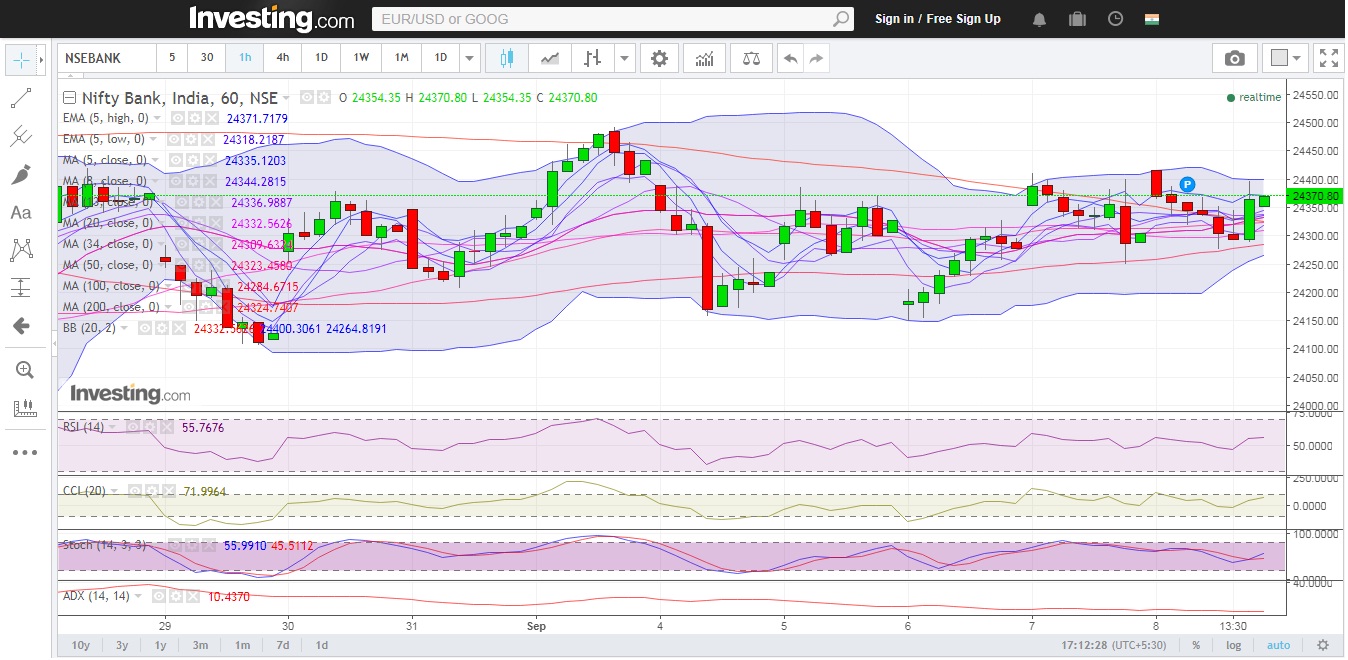
In the Hourly Chart, Bank Nifty has closed at its 5 Hour High EMA of (24371 approx).The Index is likely to face immediate resistance above the upper Bollinger Band (24417 approx) mark. Bank Nifty has to close convincingly above 24417 for the markets to be clearly in the buy zone.

Hourly RSI and CCI stands around the higher end of the normal range while the ADX is indicating that Bank-Nifty will not undergo major volatility.

Bank Nifty Survived Korean Jitters In the September Series 1

Figure: Bank-Nifty Hourly Chart

Daily Technicals:
The daily chart indicates that Bank Nifty has closed marginally below the 5 day high EMA of (24402 approx). If the Index breaks above the 24532 mark, the next resistance will be 25000. On the downside however, if Bank Nifty breaks and closes below its 5 Day low EMA (24230 approx), it could find support at the lower end of the Bollinger Band (24000 approx).

The daily RSI indicator has closed near its normal range.The CCI indicator however has closed near its upper range, while the ADX indicates lack of momentum.

Nifty Bank daily chart with Bollinger band,EMA, Support, Resistance and technical indicators RSI, CCI and ADX.

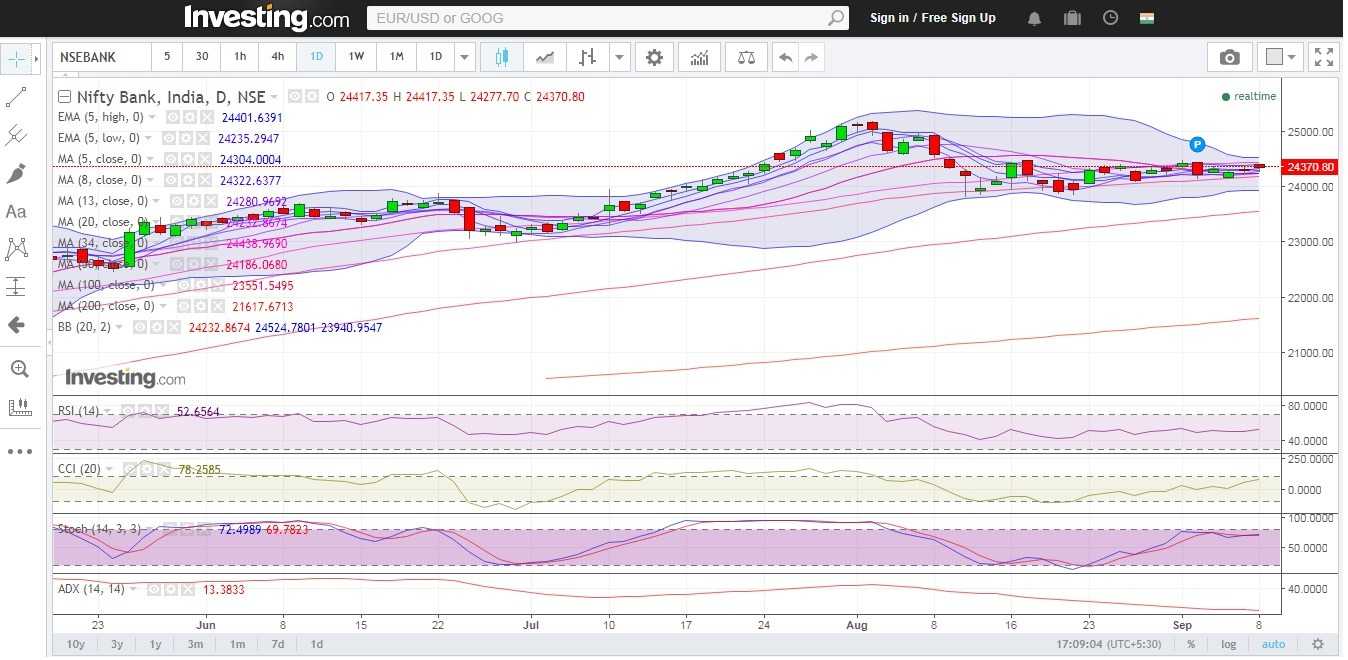
Figure: Bank-Nifty Daily Chart

Weekly Technicals:
The weekly chart indicates that Bank Nifty has closed marginally below the 8 Weekly Moving Average of (24371 approx). If the Index breaks above the 24500 mark, the next resistance will be 25000. On the downside Bank Nifty has a strong support around the 13 weekly Moving Average (24052 approx).
The Weekly RSI has closed precariously close to the 70 mark. The weekly CCI to is at the higher side of its normal range. Weekly ADX indicates that volatility is expected in the days ahead.

Bank Nifty weekly technical weekly RSI has closed 70 mark, CCI is at the higher side of its normal range and ADX indicates that volatility is expected in the days ahead.

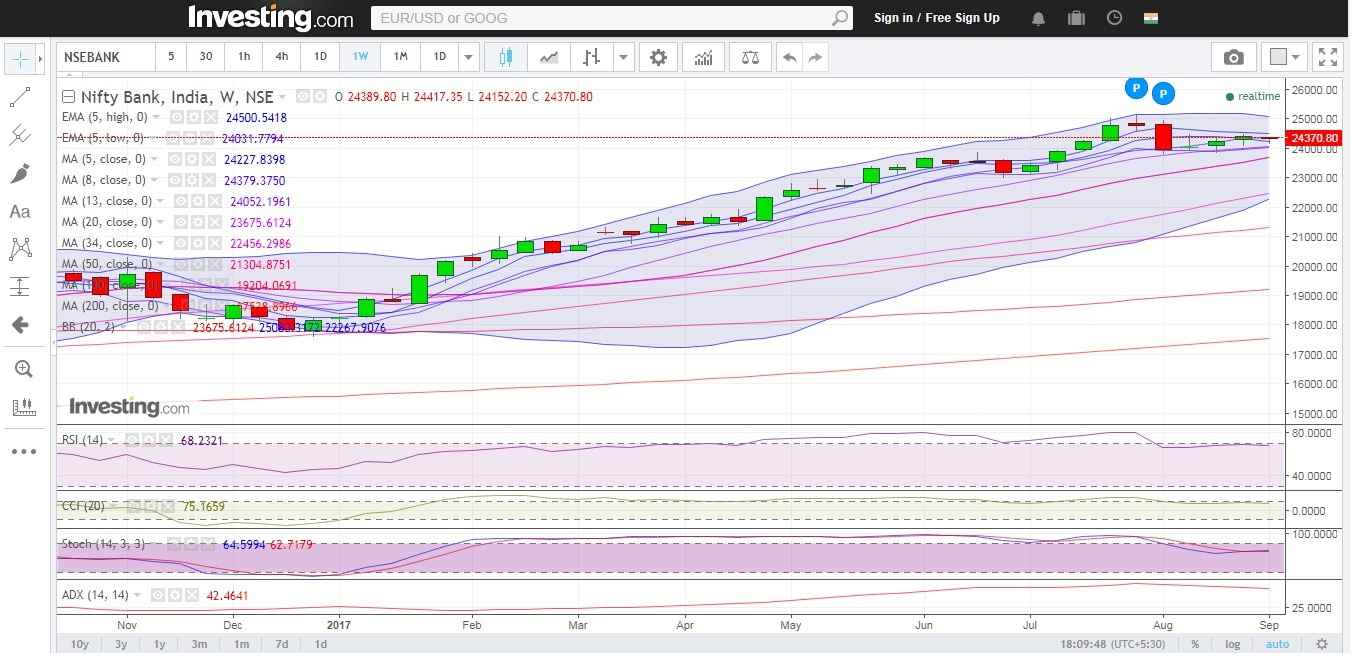
Figure: Bank-Nifty Weekly Chart
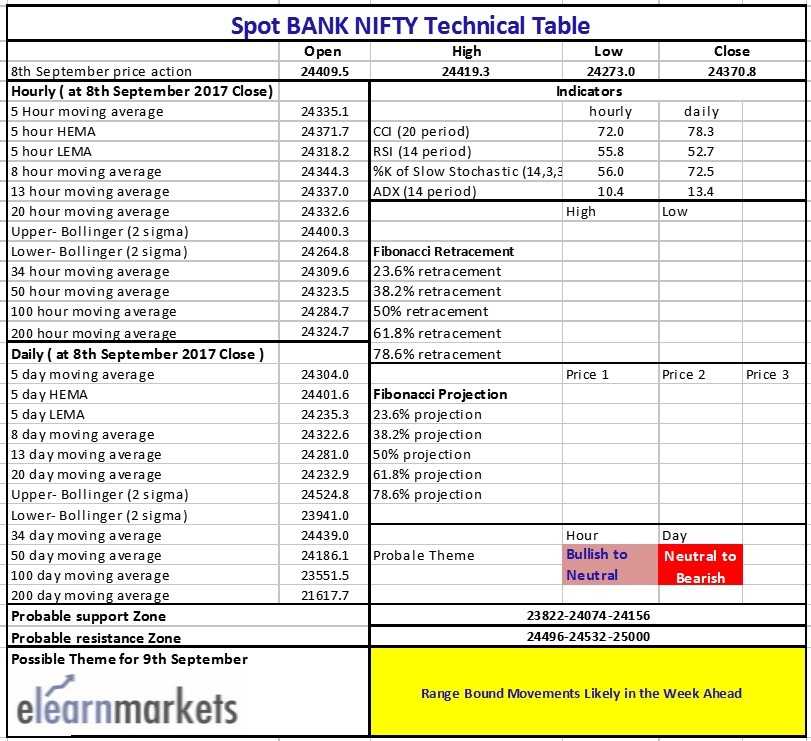
Bank Nifty Survived Korean Jitters In the September Series 2

Table

Tags: english
ShareTweetSend
Get Kotak Offer Get Kotak Offer Get Kotak Offer
Previous Post

Nifty Remains Subdued In The First Week Of September Series

Next Post

Nifty Breaks The Symmetrical Triangle With A Gap, Closes Above 10000

Elearnmarkets

Elearnmarkets

Elearnmarkets (ELM) is a complete financial market portal where the market experts have taken the onus to spread financial education. ELM constantly experiments with new education methodologies and technologies to make financial education effective, affordable and accessible to all. You can connect with us on Twitter @elearnmarkets.

Related Posts

Forex vs Stocks
Miscellaneous

Forex vs Stocks: Which Market Should You Trade First

May 13, 2025
107
Elearnmarkets's official social media handles
Miscellaneous

Official Social Media Handles of Eleanrmarkets

January 20, 2025
111
Best Personal loan Rates
Miscellaneous

5 Strategies for Finding the Best Personal Loan Rates

May 5, 2025
282
2008 Global Financial Crisis
Miscellaneous

The 2008 Global Financial Crisis

November 11, 2024
751

Leave a Reply Cancel reply

Your email address will not be published. Required fields are marked *

Disclaimer

Elearnmarkets (Kredent InfoEdge Pvt. Ltd.) is a SEBI-registered Research Analyst (RA) entity (SEBI Registration No.: INH300007493). The information provided in this article is for educational and informational purposes only and should not be considered as an offer to buy or sell any securities or investment products.

The stocks, securities, and investment instruments mentioned herein are not recommendations under SEBI (Research Analysts) Regulations, 2014. Readers are advised to conduct their own due diligence and seek independent financial advice before making any investment decisions.

Investments in securities markets are subject to market risks. Please read all related documents carefully before investing. Investing in Equity Shares,
Derivatives, Mutual Funds, or other instruments carry inherent risks, including potential loss of capital. Elearnmarkets (Kredent InfoEdge Pvt. Ltd.) does not provide any guarantee or assurance of returns on any investments. Past performance is not indicative of future performance.

Elearnmarkets Logo

Follow Us

Facebook-f X-twitter Instagram Linkedin-in Youtube Telegram

Register on Elearnmarkets

Continue your financial learning by creating your own account on Elearnmarkets.com

Register Free Account

Download App

Playstore logo
Download on app store

Categories

  • Basic Finance
  • Derivatives
  • Financial Planning
  • Fundamental Analysis
  • Technical Analysis
  • Mutual Funds
  • Miscellaneous

Popular On Elearnmarkets

  • Market Superheroes:
  • Vivek Bajaj
  • Chetan Panchamia
  • Ashish Kyal
  • Premal Parekh
  • Abhijit Paul
  • Jegan
  • Sivakumar Jayachadran
  • Jyoti Budhia
  • Vivek Gadodia
  • Vishal Mehta
  • Piyush Chaudhry
  • Santosh Pasi
  • Gomathi Shankar
  • Market Superheroes:
  • Vivek Bajaj
  • Chetan Panchamia
  • Ashish Kyal
  • Premal Parekh
  • Abhijit Paul
  • Jegan
  • Sivakumar Jayachadran
  • Jyoti Budhia
  • Vivek Gadodia
  • Vishal Mehta
  • Piyush Chaudhry
  • Santosh Pasi
  • Gomathi Shankar
  • Courses:​
  • Options Trading
  • Dow Theory
  • Momentum Trading
  • Stock Investing
  • Harmonic Chart Patterns
  • Algo Trading
  • Elliot Wave Theory
  • Advanced Excel
  • Cryptocurrency
  • NSE Certification Course
  • Courses:​
  • Options Trading
  • Dow Theory
  • Momentum Trading
  • Stock Investing
  • Harmonic Chart Patterns
  • Algo Trading
  • Elliot Wave Theory
  • Advanced Excel
  • Cryptocurrency
  • NSE Certification Course
  • Webinars:
  • Bank Nifty Scalping
  • Intraday Trading Strategies
  • Options Trading Strategies
  • Options selling
  • Price Action
  • Relative Strength
  • Tax Planning
  • Options Buying
  • Growth Stocks
  • Portfolio Management
  • Risk Management
  • Renko Charts
  • Crude Oil
  • Traders Psychology
  • Moving Average
  • Multibagger Stocks
  • Free Learning Modules:
  • Intraday Trading
  • Options Scalping
  • Swing Trading
  • Financial Modelling
  • RSI Indicator
  • Bollinger Bands
  • Pricing of Futures
  • Personal Finance
  • Initial Public Offerings (IPO)
  • Value Investing
  • Technical Indicators
  • Candlesticks
  • Chart Patterns
  • Option Greeks
  • ELSS Funds
  • Banking and Insurance
  • Real Estate
  • Gold
  • Book Summaries:
  • Rich Dad Poor Dad
  • Psychology of Money
  • The Intelligent Investor
  • The Richest Man in Babylon
  • Think and Trade Like a Champion
  • Value Investing and Behavioural Finance
  • Trading in the Zone
  • Learn to Earn
  • Book Summaries:
  • Rich Dad Poor Dad
  • Psychology of Money
  • The Intelligent Investor
  • The Richest Man in Babylon
  • Think and Trade Like a Champion
  • Value Investing and Behavioural Finance
  • Trading in the Zone
  • Learn to Earn
  • Tools:
  • CAGR Calculator
  • SIP Calculator
  • eLearnOptions
  • Future Value Calculator
  • Present Value Calculator
  • Atal Pension Yojana
  • Cost of Delay Calculator
  • Become a Crorepati
  • Tools:
  • CAGR Calculator
  • SIP Calculator
  • eLearnOptions
  • Future Value Calculator
  • Present Value Calculator
  • Atal Pension Yojana
  • Cost of Delay Calculator
  • Become a Crorepati

© 2025 Elearnmarkets. All Rights Reserved

  • Visit Elearnmarkets
  • Courses
  • Webinars
  • Financial Guides
  • Get Free Counselling
  • Visit Elearnmarkets
  • Courses
  • Webinars
  • Financial Guides
  • Get Free Counselling

Download Our App

No Result
View All Result
  • Article Categories
    • Basic Finance
    • Derivatives
    • Financial Planning
    • Fundamental Analysis
    • Technical Analysis
    • ETFs & Mutual Funds
    • Marketshala
    • Miscellaneous
  • Language
    • Hindi
    • Bengali
    • English
  • Courses
  • Webinars
  • Stories
Get Free Course

© 2024 Elearnmarkets All Rights Reserved

Guide Book on Investing with ₹ 5000
Learn about the Basics of Investments and Finance in this Ebook.
Download Guide For FREE
Trading Mentorship Program