In the stock market, volatility plays a major role, and one should understand the terms like volatility skew and volatility smile.
Volatility is frequently used to describe the degree of uncertainty or risk associated with the magnitude of changes in the value of a security.
Higher volatility indicates that the value of a security can potentially be spread out over a wider range of values.
This means that the security’s price can change dramatically in either direction in a short period of time. Lower volatility indicates that the value of a security does not fluctuate dramatically and is more stable.
So, in today’s blog, let us discuss Volatility Skew and Volatility Smile:
Understanding Volatility
Volatility represents the level of risk associated with a specific investment. It is derived from the option price and is directly related to the underlying asset associated with the option.
The IV cannot be analyzed directly. Instead, it is used as part of a formula to forecast the future direction of a specific underlying asset. The price of the associated asset falls as the IV rises.
What Is Implied Volatility?
Implied volatility is the market’s forecast of a security’s price movement. It is metric investors use to forecast future price fluctuations (volatility) based on certain predictive factors.
Implied volatility, denoted by the symbol (sigma), is frequently used as a proxy for market risk. Over a given time horizon, it is commonly expressed in percentages and standard deviations.
What is Volatility Skew?
The volatility skew is the difference between out-of-the-money, at-the-money, and in-the-money implied volatility (IV). The volatility skew, influenced by sentiment and the supply and demand relationship of specific market options, indicates whether fund managers prefer to write calls or puts.
Relative changes in skew for an options series, also known as vertical skew, can be used as a trading strategy by traders.
Understanding Volatility Skew
In most options pricing models, the implied volatility of two options with the same underlying asset and expiration date is assumed to be the same. The similarity must not be influenced by differences in option strike prices.
Options traders realized in the 1980s that even when the strike price of an option was undervalued, investors were willing to overpay for it. It implied that investors perceived downside protection to be more valuable than upside price fluctuations, given that they attributed more volatility to downside price fluctuations.
In the equity market, money managers typically prefer to write call options rather than put options. Volatility skew is caused by such a move away from the strike price.

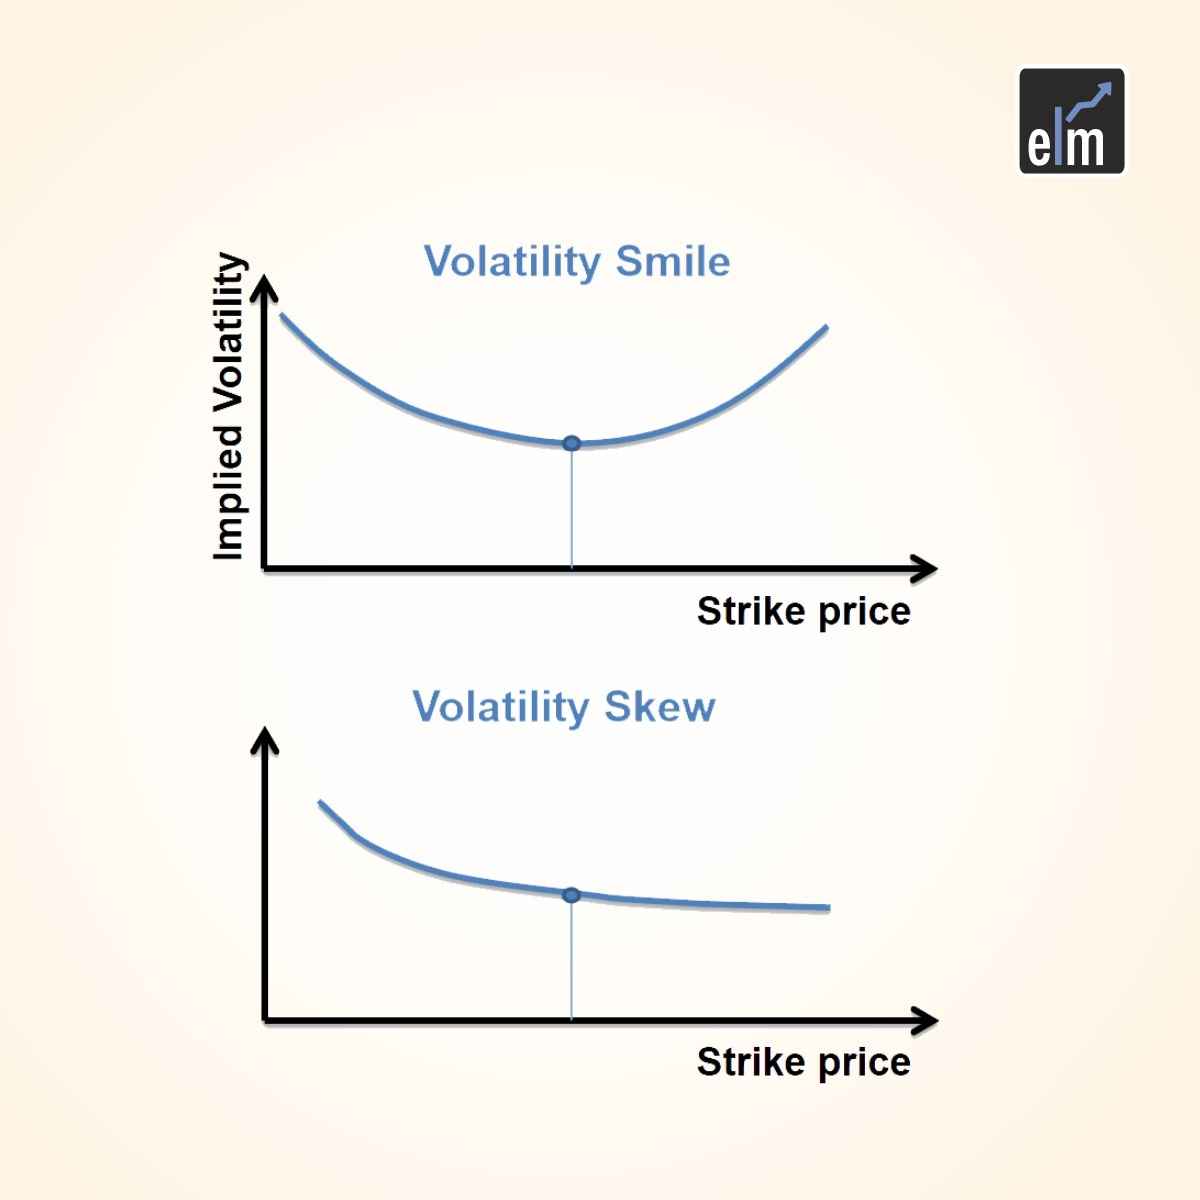
A volatility skew’s graphical representation demonstrates the implied volatility of a specific option from a given set of options. When the graph’s curve is balanced, it is called a volatility smile; when the curve is weighted to one side, it is called a volatility smirk.
What is Reverse Skew?
When the implied volatility on lower option strikes is higher, reverse skews occur. It’s most common in index options and other longer-term options. This model appears when investors are concerned about the market and buy puts to compensate for the perceived risks.
What is Forward Skew?
A forward skew is the type of skew observed when the value of the implied volatility on higher options increases. This is common in the commodities market because a demand-supply imbalance can quickly drive prices up or down. Commodities like agricultural products and oil are frequently associated with forward skews.
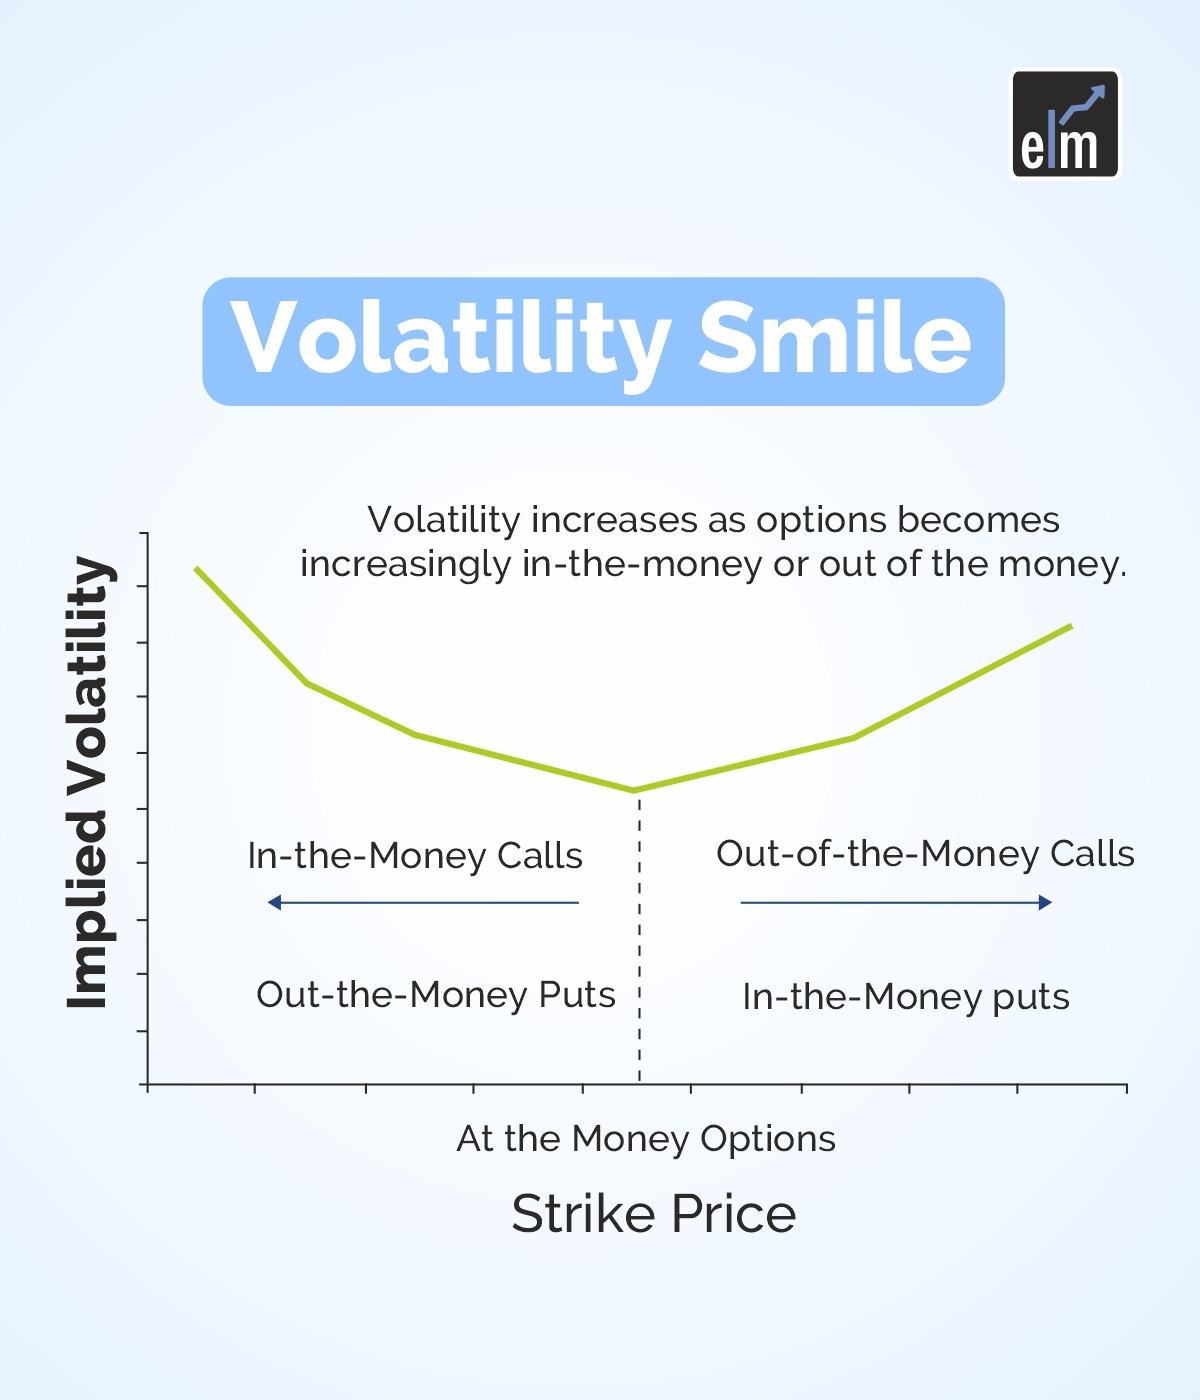
What is Volatility Smile?
Volatility smiles are caused by changes in implied volatility as the underlying asset moves more ITM or OTM. The greater the implied volatility of an option, the more it is ITM or OTM. ATM options have the lowest implied volatility.
How to analyze Volatility Smile?
When comparing different options with the same underlying asset and expiration date but different strike prices, volatility smiles can be seen. When the implied volatility is plotted for each of the different strike prices, a U-shape may appear. The U-shape is not always as well formed as shown in the graph.
Pull up an options chain that lists the implied volatility of the various strike prices to get a rough estimate of whether an option has a U-shape. Options that are ITM and OTM by an equal amount should have roughly the same implied volatility if the option has a U-shape.
You can also do our course on Certification In Online Options Strategies
The greater the implied volatility, the further ITM or OTM the option, with the lowest implied volatility near the ATM options. If this is not the case, the option does not correspond to a volatility smile.
The implied volatility of a single option could also be plotted over time relative to the underlying asset’s price. The implied volatility may take on a U-shape as the price moves in or out of the money.
Difference between Volatility Smile and Skew
While near-term equity options and forex options are more likely to align with a volatility smile, index options, and long-term equity options are more likely to align with a volatility skew. The skew/smirk indicates that implied volatility for ITM or OTM options may be higher.
Bottomline
We hope you found this blog informative and use the information to its maximum potential in the practical world. Also, show some love by sharing this blog with your family and friends and helping us spread financial literacy.
Happy Investing!
In order to get the latest updates about Financial Markets visit StockEdge
