
A chartered market technician (CMT®) is a professional technical analyst who works for the CMT Association (formerly the MTA). This global organization has been providing credentials to the financial sector for nearly 50 years. The CMT is the most prestigious accreditation for practitioners worldwide, denoting the highest level of training.
Technical analysis provides the tools to successfully bridge the gap between intrinsic value and market price across all asset classes through a disciplined, systematic approach to market behavior and the law of supply and demand. The CMT designation allows you to demonstrate that you are an expert in a broad body of knowledge about investment risk in portfolio management, including rules-based trading system design.
In this blog, we will discuss CMT and the basic understanding of the topics covered in CMT- level 2:
CMT Level-2
The CMT Level II exam necessitates a deeper level of analysis and the use of technical tools. The Level II candidate should be able to apply more advanced analytical techniques and technical analysis theory.
According to the MTA website, the Level 2 exam requires the candidate to demonstrate a greater depth of analysis as well as the use of technical tools. Candidates must demonstrate advanced analytical techniques and technical analysis theory proficiency.
Topics Covered
Let us discuss the topics covered in CMT Level-2
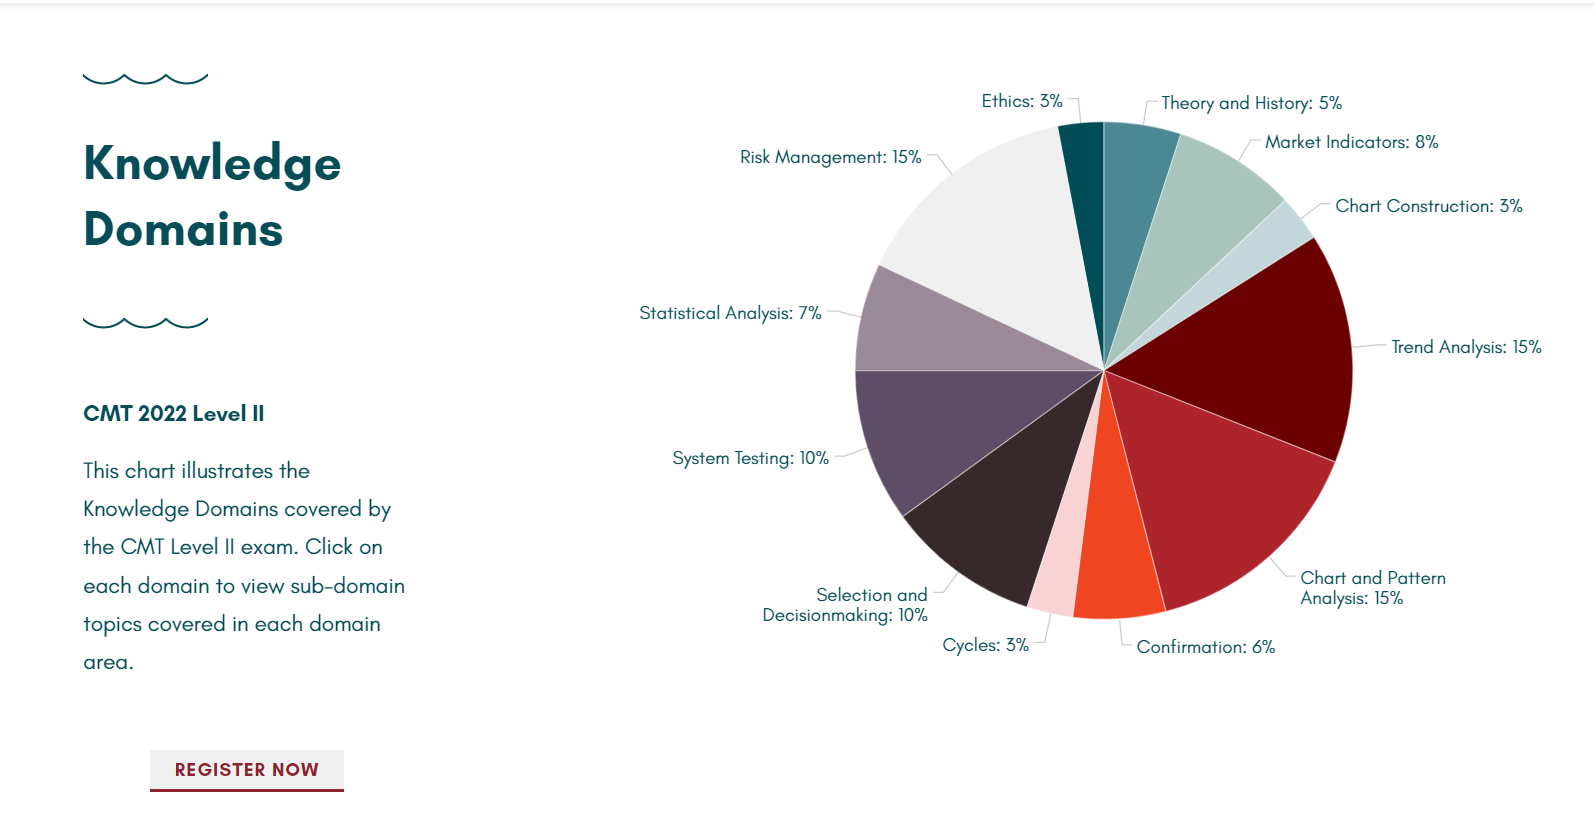
1. Theory and History
This section contains the basics of Technical Analysis, Dow Theory, and Chart Patterns. The theory lays down the guidelines to interpret market signals correctly. It is the foundation on which Technical Analysis stands today.
2. Market Indicators
A deeper dive into Technical Indicators. Understanding the basics of technical analysis will help you make better decisions as you trade. Technical indicators are mathematical patterns that technical traders and investors use to forecast future price trends, trade stocks with confidence, and earn a winning portfolio.
Technical analysis is identifying trends and probabilities of future price movement by analyzing charts, comparing indicators to previous occurrences, and making decisions based on these analyses. Technical indicators include cycle volumes, momentum reading, volume patterns, price trends, Bollinger Bands, moving averages, and many more.
3. Chart Construction
This section includes an understanding of Data Intervals and additional chart patterns like volume scaled charts or volume bars, tick bars, market profile, and so on.
A volume profile is a horizontal graph depicting the volume traded at a specific price over a specified period. It helps you to see how the recent price movement was supported by the number of shares available for trading. Volume on a time frame is meaningless because it only tells you the buying or selling intensity within the current candle. Traditional horizontal volume is ineffective for trade entry due to its inability to breakdown prior and future prices
4. Trend Analysis
Trend analysis helps you in predicting market movements. It helps make sense of the overall trend, such as bull or bearish trends. Trends can either be up or down based on bullish and bearish market sentiments.
Trend analysis helps traders make a profit when they trade with the trend and not against it. It also helps traders understand the ongoing price direction in the market during a particular period. trends can be up or down based on the bullish and bearish market sentiments, respectively
5. Chart and Pattern Analysis
The trading market is filled with news, which is the goal of any trader. Therefore knowing the difference between these two types of technical tools is important for trading using Technical analysis.
Candlestick charts are technical tools that pack data for multiple time frames into single price bars. Whereas chart patterns are the building blocks of technical analysis. They repeat themselves in the market time and are relatively easy to spot.
6. Cycles
Elliott Wave theory is used for technical analysis in the stock market. The movements of the stocks can be easily predicted when studying these waves.
Investors can get an insight into ongoing trend dynamics when observing these waves, which also helps in deeply analyzing price movements and stock performance. In this section, learn about concepts of cycle theory and applied cycle analysis.
7. Selection and Decision Making
Learn how to use Relative Strength to minimize losses and maximize profits. The strategy is suitable for both long-term and short-term trading. This section mainly focuses on Relative Strength as a criterion for an investment decision.

Relative Strength is a momentum strategy that helps us identify strong stocks for trading compared to the Index. With the help of Relative Strength, traders will look for those companies which have outperformed their peers or the Index either by rising more or falling less as compared to the peers’ or Index.
8. System Testing
This section focuses on backtesting the system, scientific method, theories of non-random price motion, system design and testing, and Rule Data Mining,
9. Statistical Analysis
This section introduces CMT Candidates to the world of statistics, such as Inferential Statistics, correlation, regression, and regression analysis which are used in trading in the stock market.
10. Risk Management
Risk management is essential for a successful trader. It’s the specific actions you take to protect your trading account from losses. You can learn to intelligently weigh the risk/reward of every single trade. And over time, your months and years of experience can add up. And over time, you can better learn to intelligently weigh the risk/reward of every single trade.
You can also do our cours on TRADING MENTORSHIP PROGRAM
111. Ethics
The Standards of Practice Handbook can help you prepare for the CMT tests. It’s an important document that “grounds the concepts contained in the Code and Standards for practical usage.” Get your study plan in place, read it, then brush up on your knowledge before taking your exam
Learn to predict market moves with precision. Enroll in our Candlestick Pattern Course and take your trading to next level.
Bottomline
We hope you found this blog informative and use it to its maximum potential in the practical world. Also, show some love by sharing this blog with your family and friends and helping us in our mission of spreading financial literacy.
Happy Investing!

