Our job as traders is to look for trading opportunities in the stock market. When used correctly, indicators can undoubtedly help with this. The Relative Strength Index is no exception. When used correctly, it can aid in predicting rising momentum, underlying demand or supply, and sentiment shifts.
The indicator can also forecast trends, trend reversals, trend continuations, and stagnate corrections. The RSI indicator can be a helpful tool in your trading arsenal with practice and a firm understanding of volume and price action. The Relative Strength Index (RSI) compares the strength of up days versus down days to determine how well a stock performs relative to itself.
So, in today’s blog, let us discuss how to use the RSI Indicator and also discuss some index trading strategies.
What is Relative Strength Index?
J.Welles Wilder created the RSI and detailed it in his book New Concepts in Technical Trading Systems in June 1978. The Relative Strength Index (RSI) compares the strength of up days versus down days to determine how well a stock performs relative to itself. This number is calculated and has a range of 0 to 100.
A reading of 70 or higher is considered bullish, while a reading of 30 or lower is considered bearish. It is generally helpful to track periods of overbought or oversold conditions.
How to Use RSI?
Below are the ways of how we can use RSI Indicator:
1. Overbought\Oversold
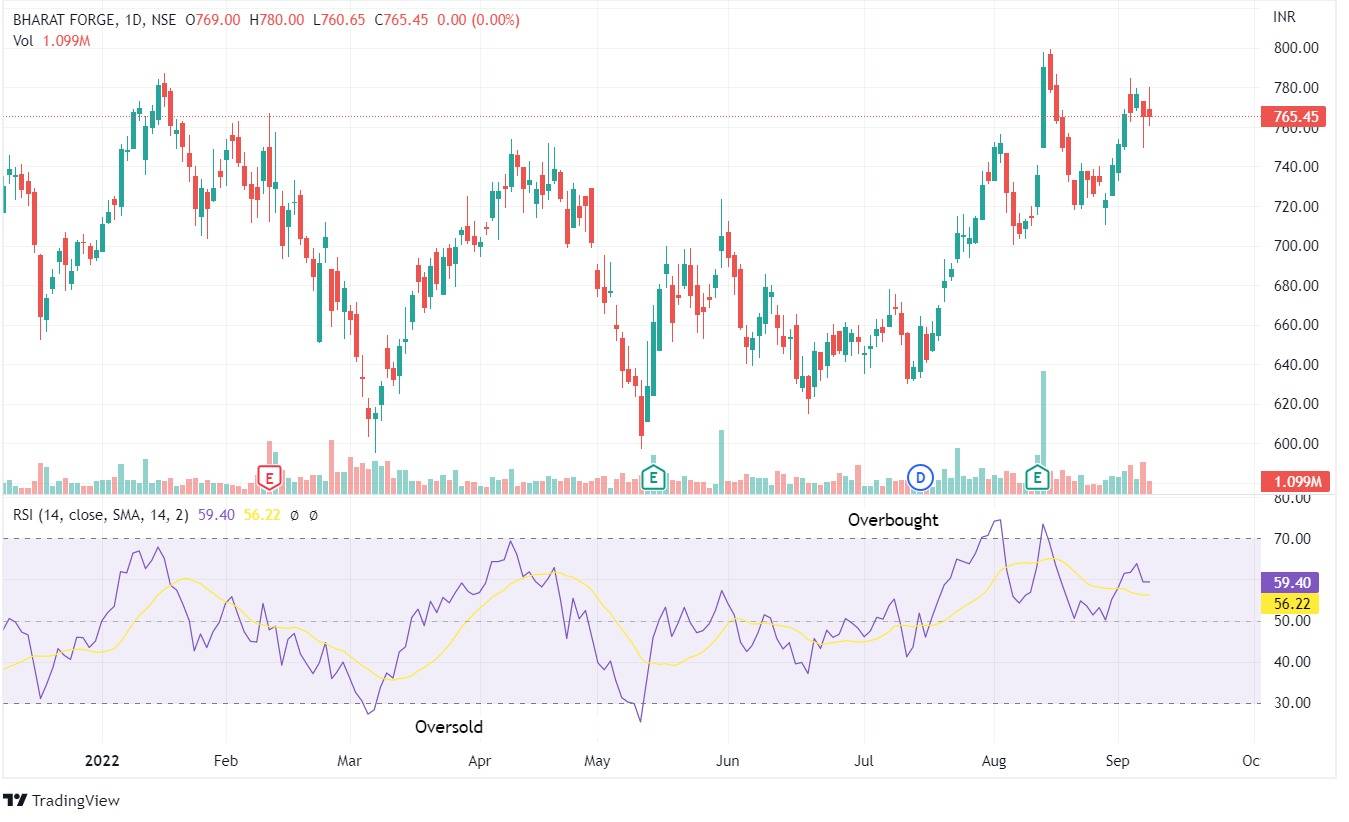
When the RSI rises above 70, it is considered overbought; when it falls below 30, it is considered oversold. These traditional levels can also be adjusted to fit the security better if necessary. For example, if security consistently reaches the overbought level of 70, you may want to increase this level to 80.
Please remember that during strong trends, the RSI may remain in overbought or oversold territory for extended periods.
2. Patterns
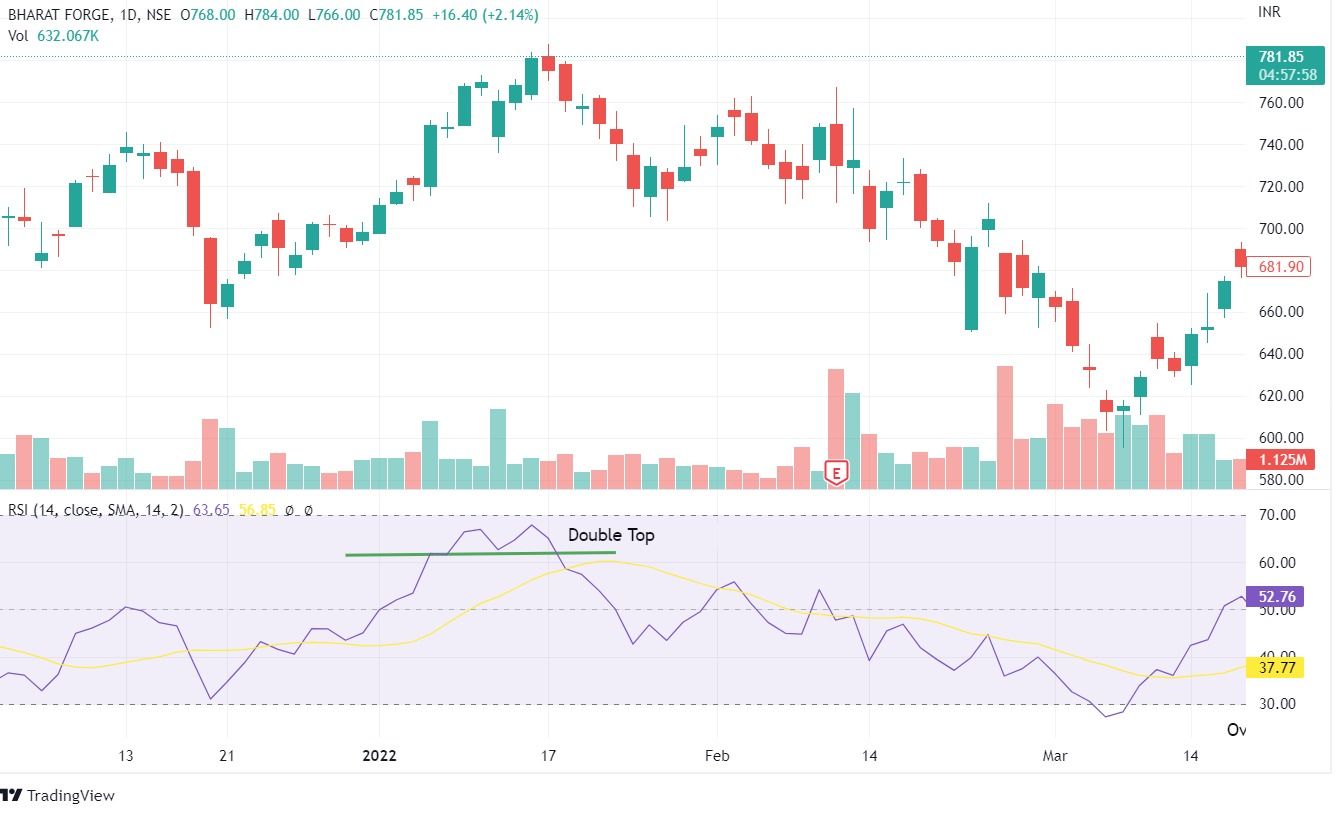
RSI also frequently forms chart patterns that may or may not be visible on the underlying price chart, such as double tops, bottoms, and trend lines. Look for support or resistance on the RSI as well.
3. Trending Market
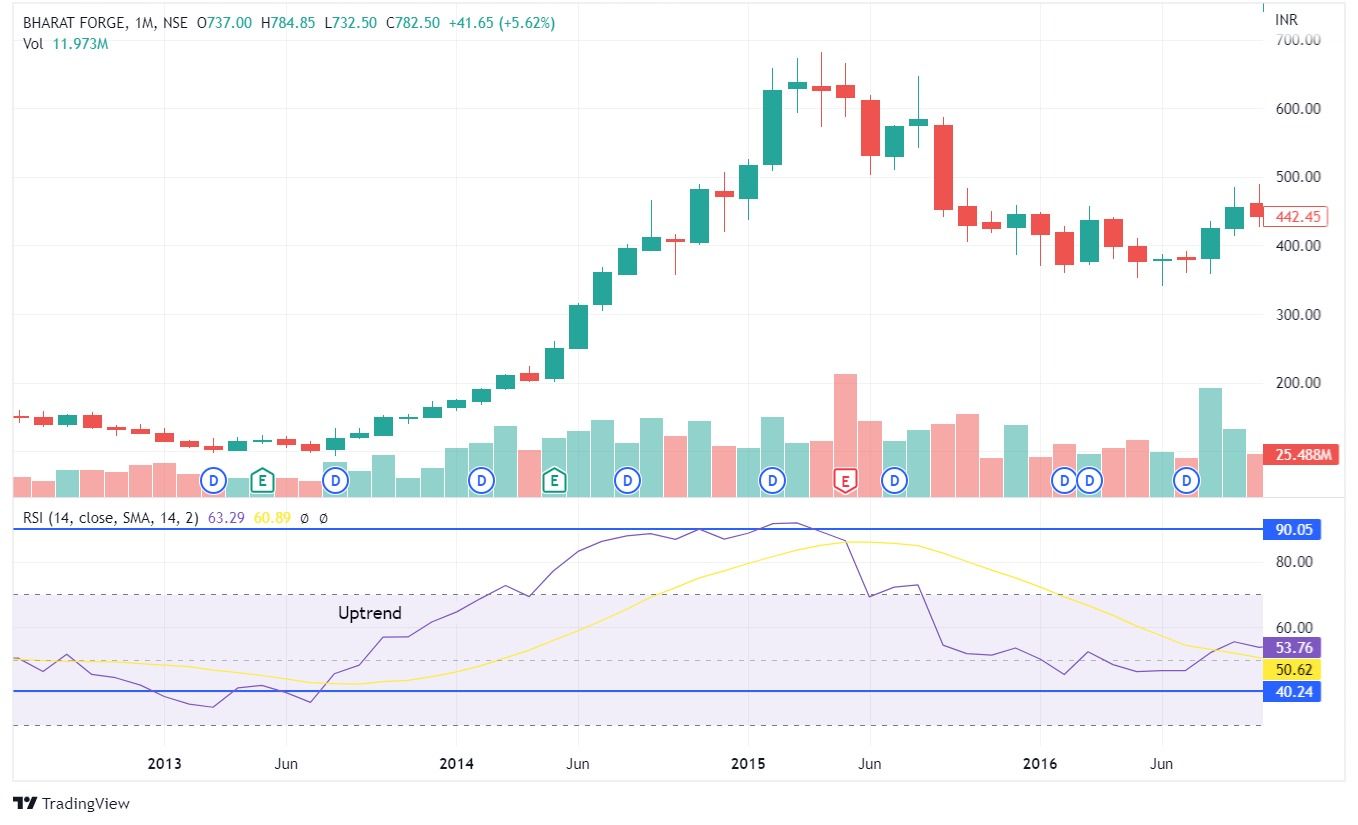
The RSI tends to remain in the 40 to 90 range during an uptrend or bull market, with the 40-50 zone acting as support. The RSI stays between 10 and 60 during a downtrend or bear market, with the 50-60 zone acting as resistance. These ranges will vary depending on the RSI settings and the strength of the underlying trend of the security or market.
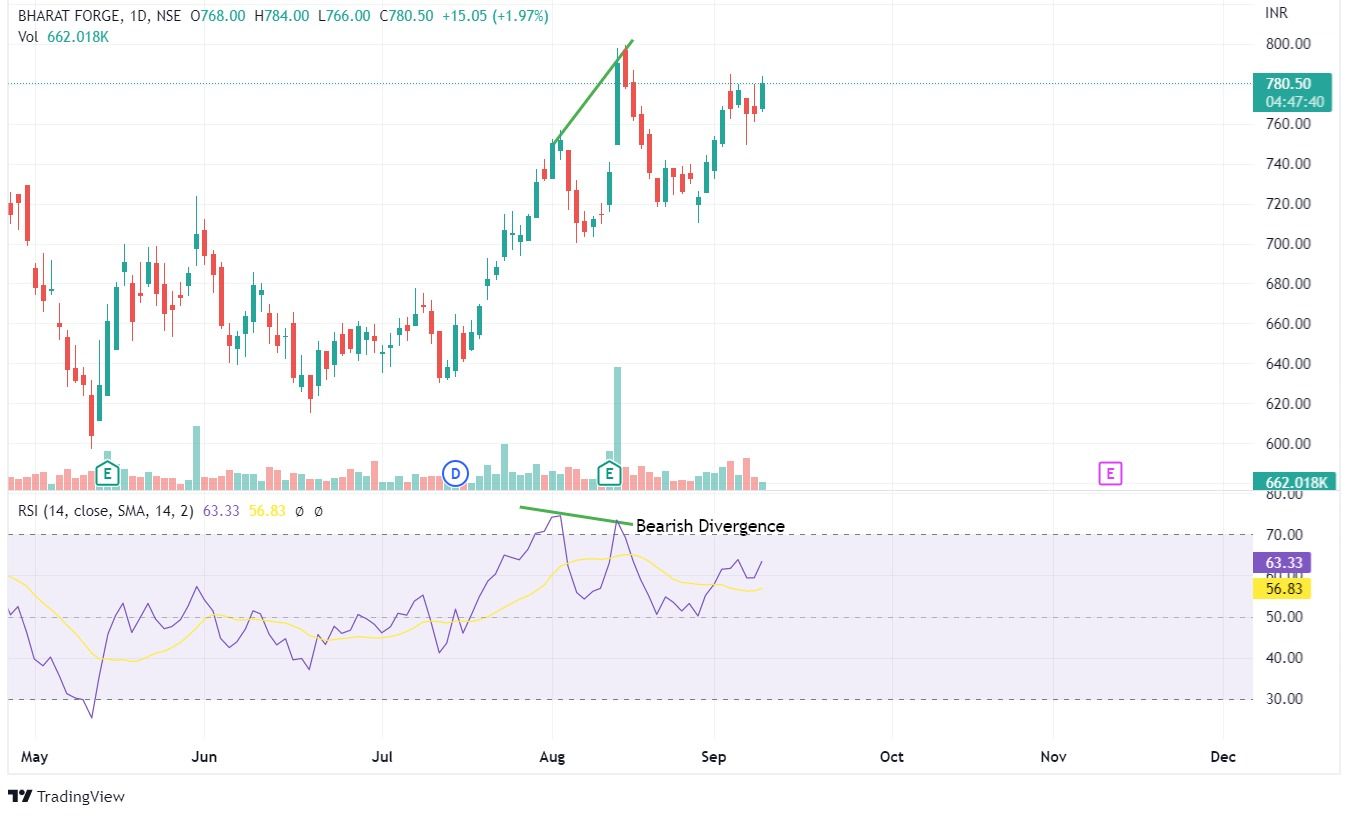
4. Divergences
If underlying prices make a new high or low that the RSI does not confirm, the divergence may indicate a price reversal. A Top Swing Failure occurs when the RSI makes a lower high and moves lower below a previous low. If the RSI makes a higher low and rises, a Bottom Swing Failure occurs.
Having understood how we can use RSI Indicator in trading, let us discuss some index trading strategies:
Trading Strategies Using RSI
1. RSI with MACD
This is Ultra Cement Ltd.’s 15-minute chart. The green circle in this relative strength index example represents the times we receive entry signals from both indicators.
We notice the relative strength index leaving an oversold condition slightly more than an hour after the morning open, which is a clear buy signal. In addition, the MACD performs a bullish crossover the following period, which is our second signal.

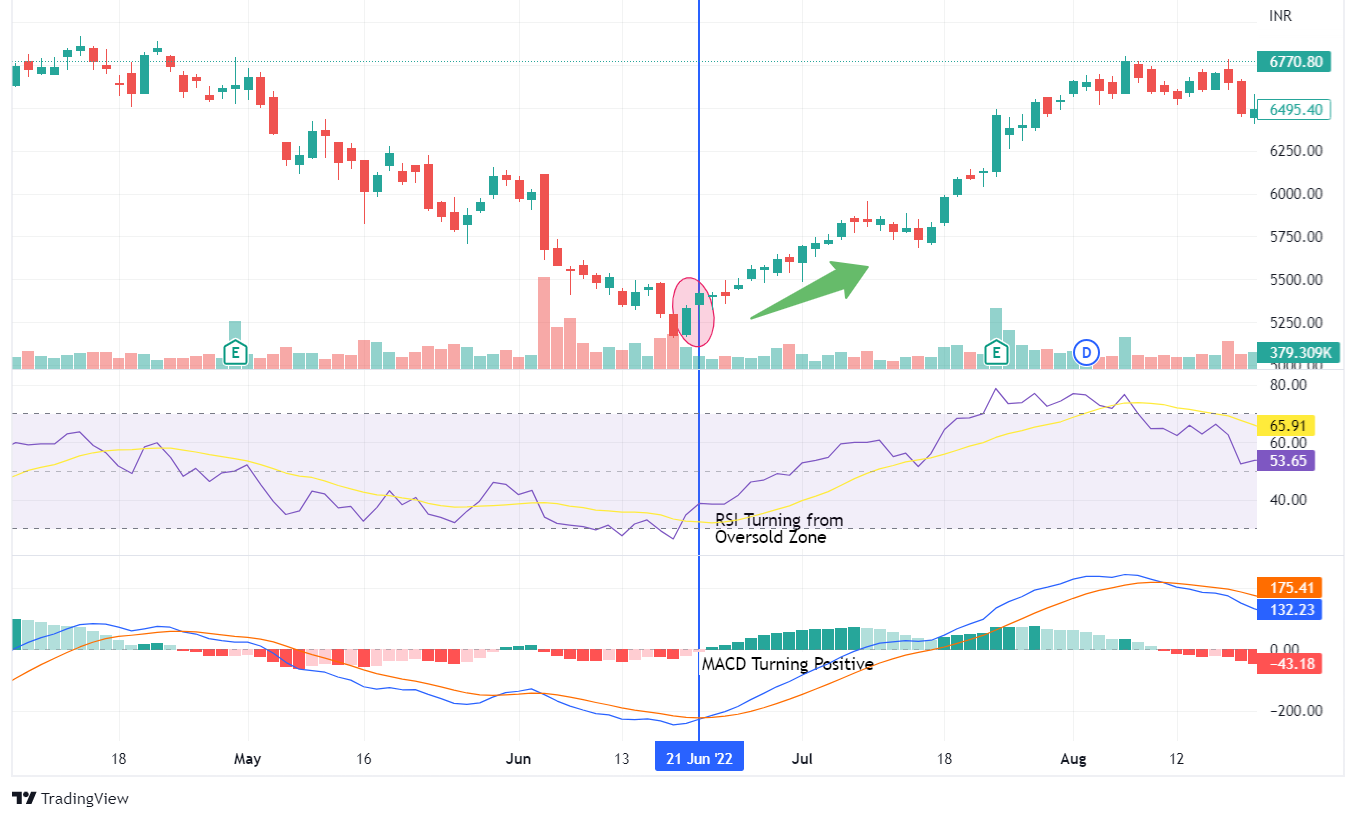
We go long on this stock because we have two matching signals from the indicators. First, we appear to be at the start of a long-term bullish trend.
2. RSI with MA Crossover
We will match the RSI with the moving average indicator in this trading strategy. The 4-period and 13-period moving averages will be used for the moving averages.
When an RSI crossing 50-line coincides with a supportive crossover of the moving averages, we will buy or sell the stock. On that note, we will hold the position until we receive a reversal signal from one of the two indicators or see a divergence on the chart.
First, let’s clear up some confusion about MA cross-exit signals. A regular deviation from the moving average is an insufficient reason to exit a trade. Therefore, before exiting the market, we recommend waiting for a candle to close above both lines of the moving average cross.
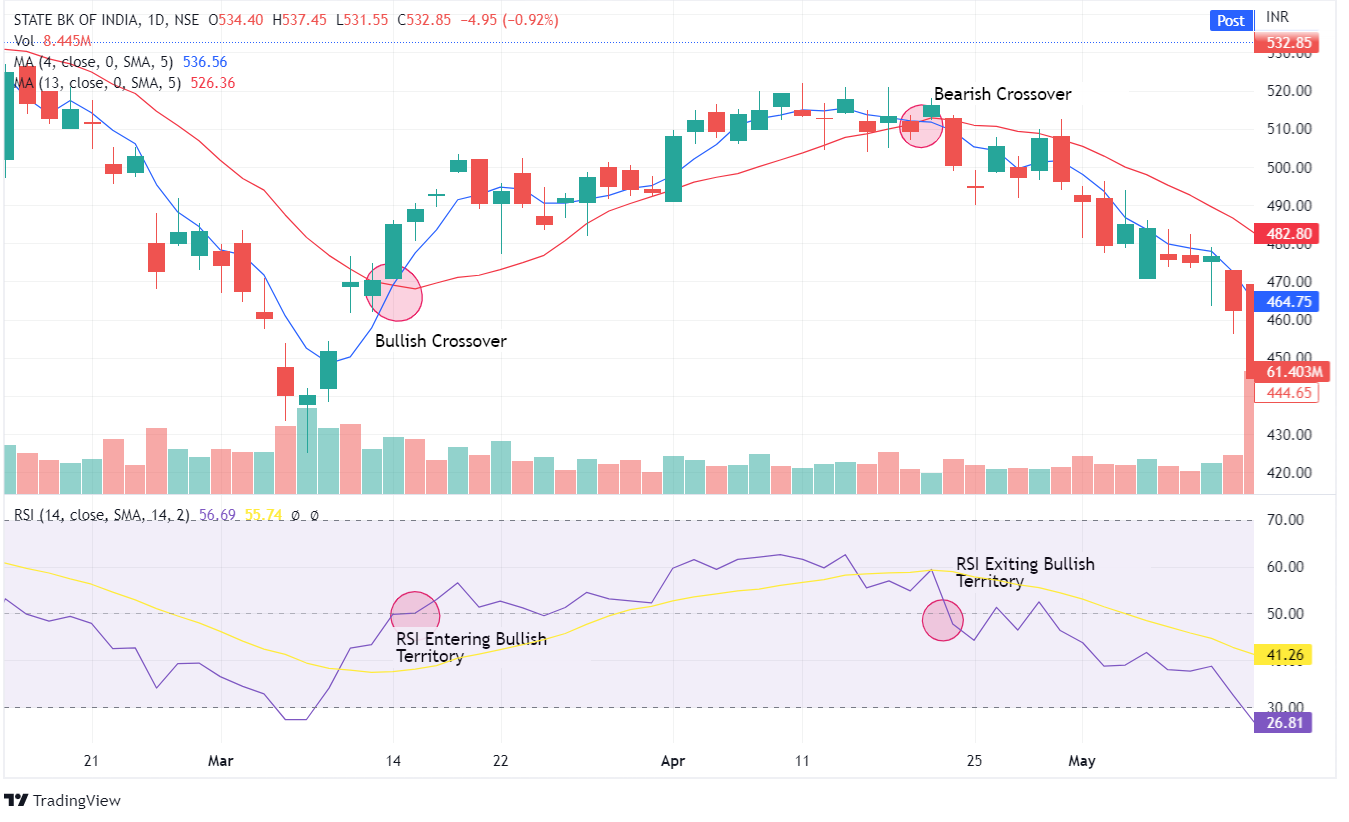
From the daily chart of State Bank of India Ltd., we can see how RSI crosses the 50-line co-incidence with MA crossovers and gives a bullish signal to enter the stock. On the other hand, we can exit the stock when the RSI crosses the 50 lines from above and there is a Bearish MA Crossover.
3. RSI and Price Action Trading
For this strategy, we’ll use the relative strength index signals in conjunction with any price action indicator, such as candlesticks, chart patterns, trend lines, channels, etc.
You will need an RSI signal and a price action signal – candle pattern, chart pattern, or breakout – to enter a trade. The goal is to hold each trade until a contrarian RSI signal or price movement confirms that the move has ended.
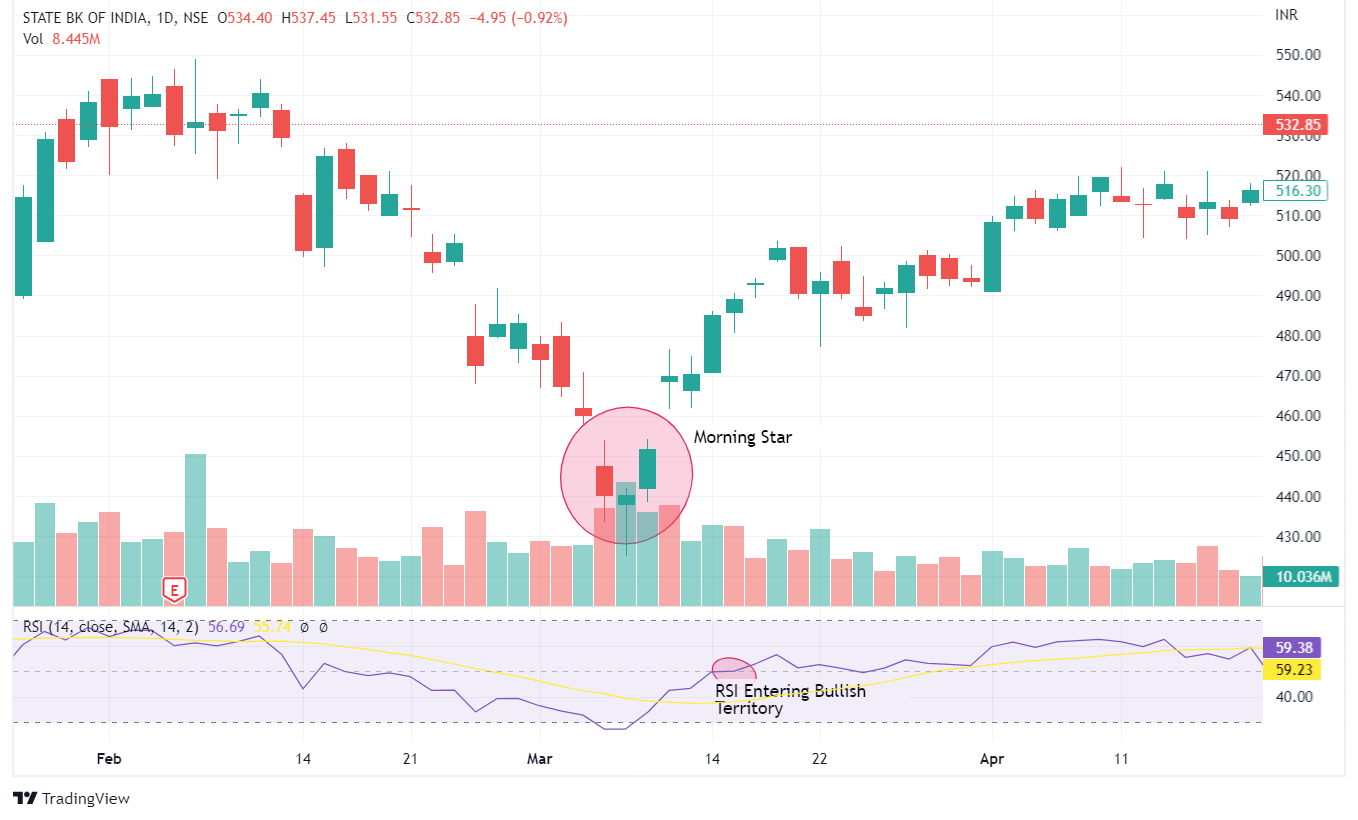
In the daily chart of State Bank of India Ltd, we can see that the candlesticks formed a Morning Star Pattern, and RSI also entered the bullish territory. Both the RSI and candlestick patterns give us bullish signals to enter the stock.
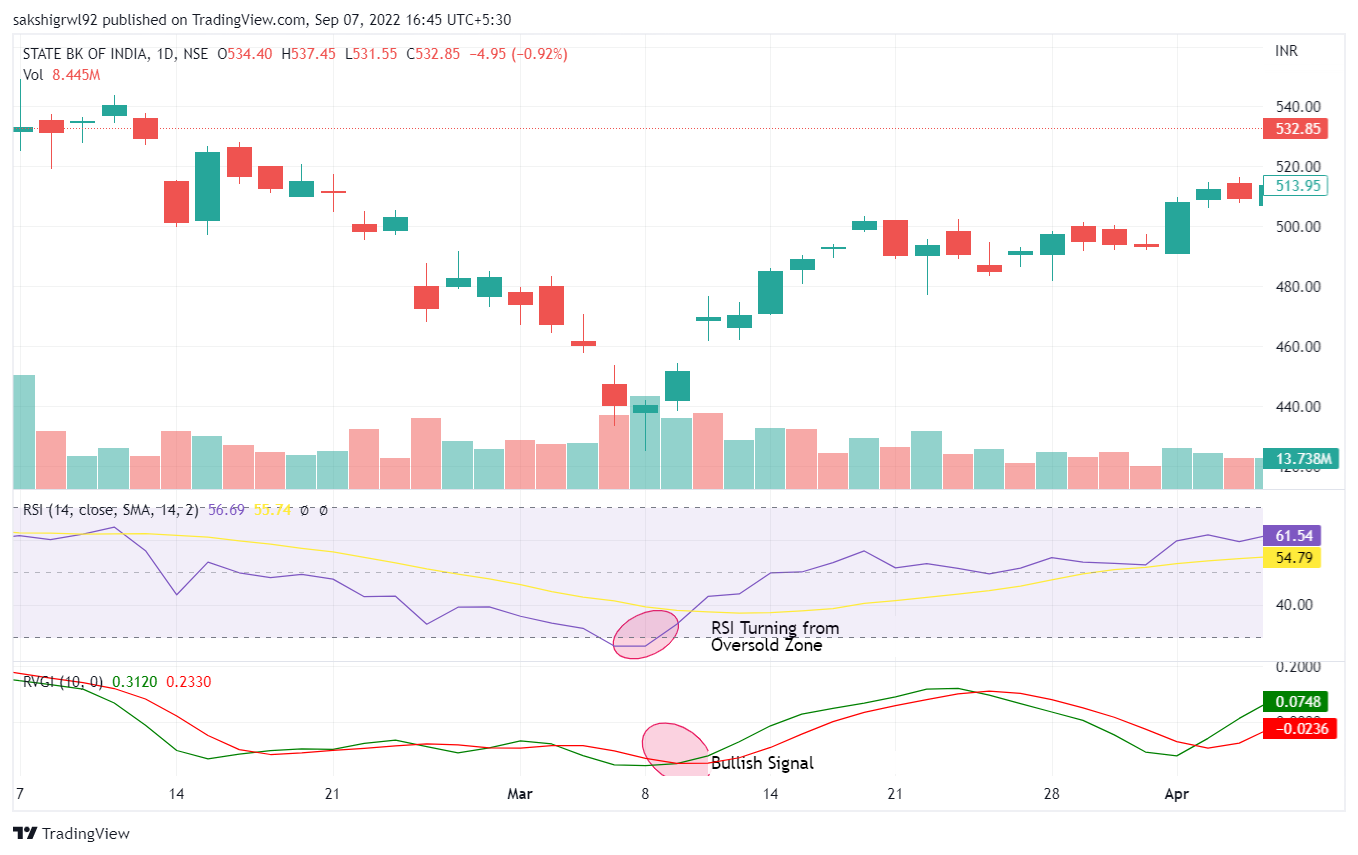
4. RSI and Relative Vigor Index
We’ll combine the relative strength and vigour index for this RSI trading strategy. In this strategy, you will only enter the market if both indicators produce matching signals. Then, hold the position until one of the tools gives you an opposite signal.
5. RSI with Keltner Channel Indicator
We examine the Keltner Channel’s slope: upward slope for possible long entries and downward slope for possible short positions. When the RSI closes above 50, and the Keltner Channel slope is upward, we look for buy entries. We look for short entries when the RSI falls below 50, and the Keltner Channel slopes downward.
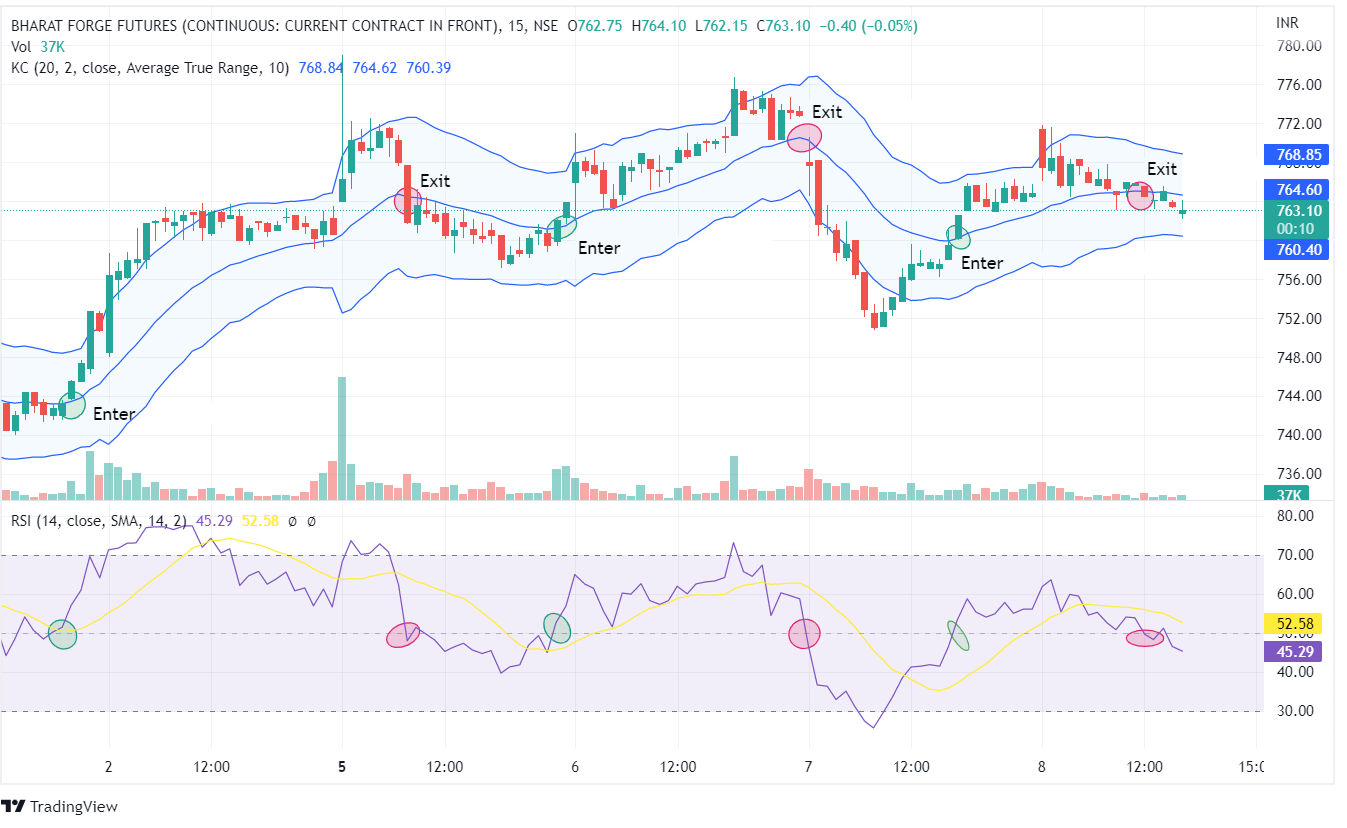
When we enter the market long, we place our stop-loss order below the Keltner Channel, and when we enter the short market, we place our stop-loss order above the Keltner Channel. We should use a trailing stop if we want to ride the trend as much as possible.
You can also join our course on Certification In Online Technical Analysis
Bottomline
If you’re new to trading, combining the relative strength index with another indicator, such as volume or moving averages, is a good start. When you pair it with the indicator, you will get a fixed value from which you can decide. It also eliminates many of the ambiguities associated with trading.
As your trading career progresses, you may want to consider more subjective price action methods. In addition, you may be able to apply techniques specific to the security you are trading at this point, which may increase your winning percentages over time. However, this level of trading requires a lot of practice.
Frequently Asked Questions (FAQs)
1. What is the Relative Strength Index (RSI)?
As a momentum oscillator, the Relative Strength Index (RSI) gauges the rate and direction of price changes. It is used to determine whether an asset is overbought or oversold by oscillating between 0 and 100.
2. How is RSI calculated?
Average gain and average loss over a given time period—usually 14 days—are used to compute RSI. RSI = 100 – [100 / (1 + RS)], where RS (Relative Strength) is equal to Average Gain / Average Loss, is the formula.
3. What does it mean when RSI is overbought or oversold?
The asset may be overpriced and in need of a correction when the relative strength index (RSI) is above 70, which is regarded as overbought. In contrast, an oversold indicator, or RSI below 30, suggests that an asset may be cheap and ready for a recovery.


