Elearnmarkets - Financial Market Learning
  • Courses
  • Webinars
  • Stories
  • Language
    • English
    • Hindi
    • Bengali
No Result
View All Result
Get Free Course
  • Basic Finance
  • Derivatives
    • Futures
    • Options
  • Financial Planning
  • Fundamental Analysis
  • Technical Analysis
  • Mutual Funds
  • Marketshala
  • Miscellaneous
Elearnmarkets - Learn Stock Market, trading, investing for Free
  • Courses
  • Webinars
  • Stories
  • Language
    • English
    • Hindi
    • Bengali
No Result
View All Result
Get Free Course
Elearnmarkets - Learn Stock Market, trading, investing for Free
No Result
View All Result
Home Technical Analysis
Relative Strength Strategy by Mr Matthew Caruso 1

Relative Strength Strategy by Mr Matthew Caruso

Elearnmarkets by Elearnmarkets
December 3, 2024
in Technical Analysis
Reading Time: 9 mins read
0
3.9k
VIEWS
Share on FacebookShare on XShare on WhatsApp

In an interesting session as a part of the highly popular Face2Face series, conducted by Elearnmarkets, Mr Vivek Bajaj, Co-founder of Elearnmarkets, invited Mr Matthew Caruso, a successful stock market investor with many years of experience, to decode the Relative Strength Strategy.

Matthew Caruso is a professional investor. He is a former market maker, university finance professor, and a past president of the Canadian Society of Technical Analysts. In addition to his Economics major, he also holds CFA and CMT designations. In 2020 Matthew returned 346% in the US Investing Championship.

In this blog, Mr Matthew Caruso and our host Mr Vivek Bajaj, co-founder of StockEdge and Elearnmarkets, will discuss using the Relative Strenght Strategy.

Table Of Contents
  1. Relative Strength Meaning
  2. Decoding Mr Matthew Caruso’s Relative Strength Strategy
  3. Trading Example- CDSL India Ltd.
  4. How do select companies for trading?
  5. Bottomline

Relative Strength Meaning

Relative strength is a popular indicator used by traders in the Indian and global markets.

This concept is not too complicated- if there’s a beta of one, it means that if yet if the index is up by one per cent your stock should be up by one per cent, if the beta is two and the index is up to one per cent your stock should be up to two per cent twice as much so this beta number gives a really good insight into how your stock should act.

 So, once you know how your stock should act, that gives you a good benchmark to tell if your stock is acting strongly or negatively, which helped him.

If the stock should be up to two per cent and we’re up to three per cent that’s relative strength that alpha is called alpha; that relative stren is key, and so he took that as his base concept.

He has a couple of time frames within the actual analysis. Still, because beta adjusts for volatility and has this alpha indicator, you can use this on a stock with low volatility, like a bank stock. You could use this on a very volatile growth stock, a young, you know, small-capitalization stock, and you can very instantly know if we have relative strength or not.

Decoding Mr Matthew Caruso’s Relative Strength Strategy

Mr Matthew Caruso, first of all, explains his trading template. He says that the most above one is the Nasdaq- look at how many stocks each day are making new 52-week highs and how many are making new 52-week lows.

He likes to use that analysis because sometimes the general market if we look at the Nasdaq 100, seven stocks represent 51 per cent of the index, so if we are not in the biggest companies, the index sometimes doesn’t give a very good glimpse of what’s going on to most stocks so by looking at the number of stocks just making new highs versus new lows gives him some very good insights.

relative strength

If we look at the Nasdaq composite here, you can see that the market topped back in November internally. However, the market looked very strong internally; many stocks were already starting to break down and make new lows right off the bottom. As we started to rally, that changed positively for a little bit, and now it looks to be getting negative again.

But he likes to keep it at the bottom of my charts just to give me a good sense of whether the general trend for general stocks is positive or negative.

So just focusing on the actual individual stock, once we know how he determined that we have this great long-term view, this long-term overview, he kind of flips to the shorter-term aspect to see where he can buy this stock now with very low risk.

So once you have this, you understand the general trend, flip to the shorter-term time frame, and look for entries to trigger when to buy or sell the stock.

Typically these trigger points would be one of those moving averages retracement or some price demand zone, so he likes to use the averages just for a sense of trend. One of my very important rules is the blue line. Here is my 200-day moving average.

He will never buy a stock below the 200-day moving average, so he makes sure it’s above there once we have the general chart pattern.

He likes to use many patterns, some very simple ones you can just put a nice trend line over the tops of your charts.

Relative Strength Strategy by Mr Matthew Caruso 2

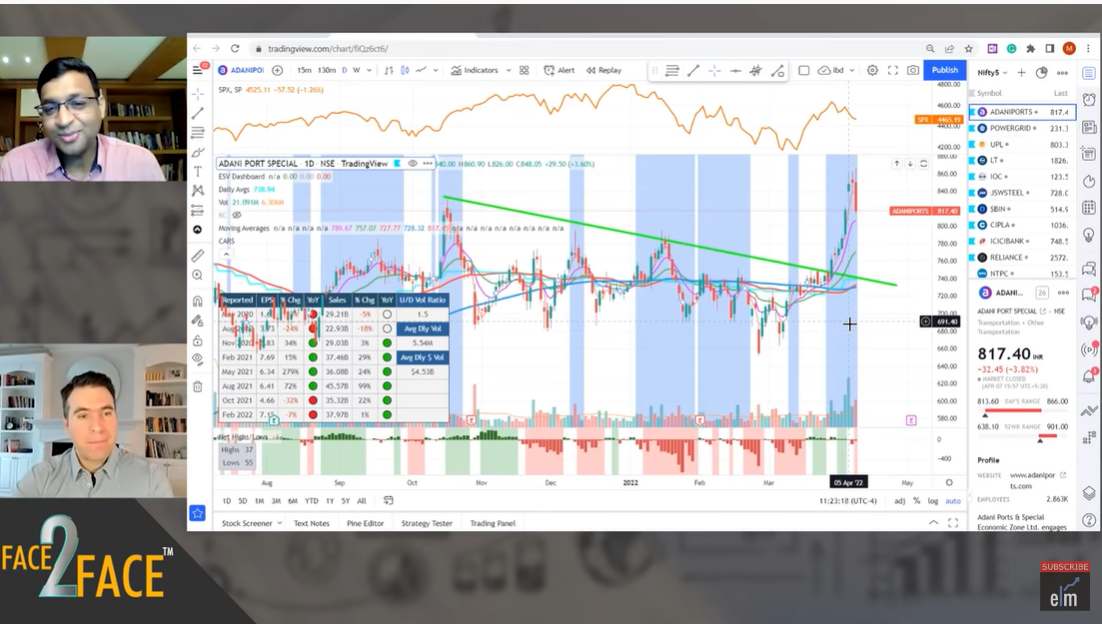
So, for example, if he draws the trend lines, he thinks it is very important to need three important touches because if you draw two touch points, and two touch points in the chart will be a trend line, so to be a good trend line.

Trading Example- CDSL India Ltd.

Let’s start on the weekly chart to get the big picture first. Mr Matthew Caruso thinks that’s always very helpful.

So, you can see here actually at these earnings’ growth, he means it went from 821 to 987 to 1086, we had a bit of a slowdown in 2021, but a powerful move to 1917 and you see what’s reflected in the stock what drives earnings moves.

He means that what drives stock moves its earnings or the company’s ability to bring more earnings, and you always see that and already beginning with a company that has these great fundamentals over the past few years.

If this had been your focus, you had this opportunity for these big advances, so it’s a powerful growing company.

The way he approaches the market, you know, some people say he wants always to be invested and have some portfolio exposure, he wants very targeted exposure. If it’s no longer targeted exposure, then he doesn’t want to be in it anymore.

Relative Strength Strategy by Mr Matthew Caruso 3

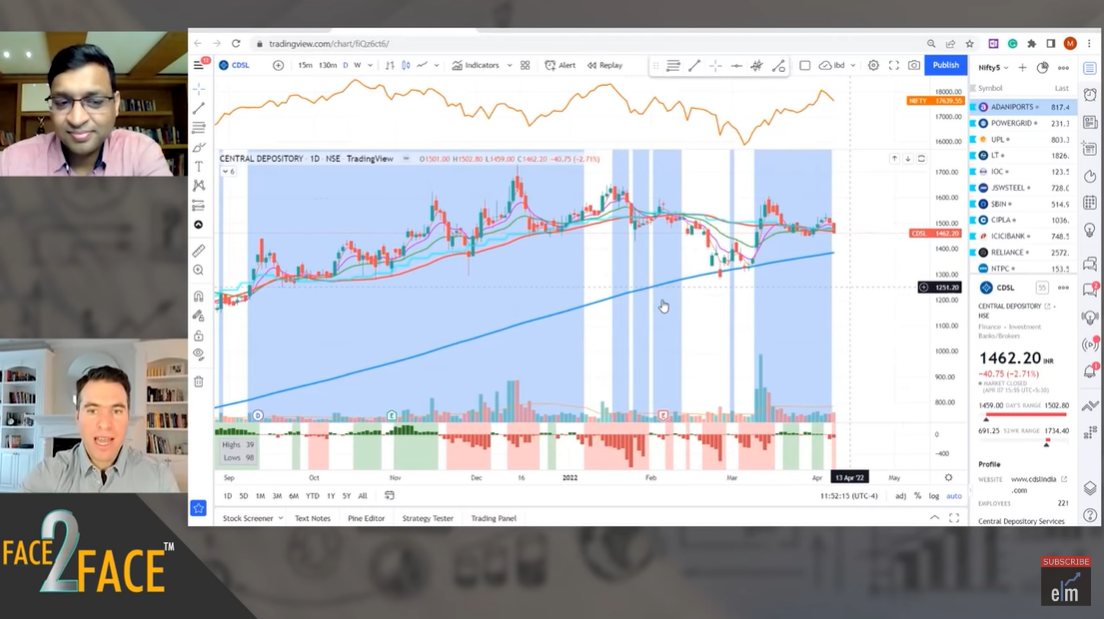
So, you can see so for CDSL if you notice on the advance when these stocks have big advances, this is the 10-week average which is similar to the 50. 

It basically always stays above that 10-week line, and it’s such a strong support area on the advance, and you see, even though it’s an Indian company, the same techniques work now. 

One thing to notice is that here now, as the nifty has been advancing and is basically near its highs, this is starting to lose its relative strength, and I think that comes through as well on a daily chart here.

He thinks just today is starting to get back into a white background versus the blue background, so you know when you’re sitting with a very large profit, you can give it a little more space you can see the state above the 50-day the whole time, but now it has a hard time the character of the stock is changing here.

You can also watch our webinar on Relative Strength

We broke below the 50 to the 200, and now we’re just right back above it, but if we were to break below, especially this low, you’d have to realize that something’s changed.

Sometimes the earnings growth becomes factored into the stock price, and then after investors look are always looking to the future, and they’re saying look into the future, they don’t see that same kind of earnings growth happening, and the stock will sell-off

Sometimes you take your profits while you’re sitting with significant gains or if you say, look, he has faith in the company, he wants to give it a little more leeway, a little more space well, then his rule is never own a stock below a 200-day moving average so if it were to break below that 200-day that would be my absolute line and exit the position.

You can also join our course on Certification In Online Technical Analysis

How do select companies for trading?

So, once he starts looking at stocks making record annual earnings, he looks at those with the biggest growth numbers, so he prefers a company that’s growing at 30 40 50 a year.

 You automatically take your universe of companies from 10 000 to 150. So now you have 150 stocks left, then you go to relative strength. How many of these are showing relative strength now you cut your 150 stocks down to 40. 

And now of these 40 where do we see a buy pattern, then we are down to four, and that’s how we suddenly create what seems unusable so many stocks where do we begin to having a very focused target of and where we are going to put our capital.

You can watch the entire Face2Face video here

Bottomline

We hope you found this blog informative and use it to its maximum potential in the practical world. Also, show some love by sharing this blog with your family and friends and helping us in our mission of spreading financial literacy.

Happy Investing!

You can also visit web.stockedge.com, a unique platform that is 100% focused on research and analytics.

Tags: englishFace2Face seriesrelative strengthtechnical analysis
ShareTweetSend
Get Kotak Offer Get Kotak Offer Get Kotak Offer
Previous Post

Advance Volume Spread Analysis of Big Players in Stock Market by Mr Karthik Ramachandan

Next Post

Understanding Butterfly Options Strategy -Long and Short Butterfly

Elearnmarkets

Elearnmarkets

Elearnmarkets (ELM) is a complete financial market portal where the market experts have taken the onus to spread financial education. ELM constantly experiments with new education methodologies and technologies to make financial education effective, affordable and accessible to all. You can connect with us on Twitter @elearnmarkets.

Related Posts

Understand Slippage in Trading
Technical Analysis

What is Slippage in Trading? Meaning & Examples

March 28, 2025
305
Breakout trading strategies
Technical Analysis

Top 5 Breakout Trading Strategies

March 12, 2025
1.1k
5 stocks for today
Technical Analysis

5 Stocks to Buy Today That Could Beat the NIFTY in 2025!

May 5, 2025
401
Image describing What is marginal trading facility
Technical Analysis

 What is a Margin Trading Facility? Advantages & Risks

April 4, 2025
663

Leave a Reply Cancel reply

Your email address will not be published. Required fields are marked *

Disclaimer

Elearnmarkets (Kredent InfoEdge Pvt. Ltd.) is a SEBI-registered Research Analyst (RA) entity (SEBI Registration No.: INH300007493). The information provided in this article is for educational and informational purposes only and should not be considered as an offer to buy or sell any securities or investment products.

The stocks, securities, and investment instruments mentioned herein are not recommendations under SEBI (Research Analysts) Regulations, 2014. Readers are advised to conduct their own due diligence and seek independent financial advice before making any investment decisions.

Investments in securities markets are subject to market risks. Please read all related documents carefully before investing. Investing in Equity Shares,
Derivatives, Mutual Funds, or other instruments carry inherent risks, including potential loss of capital. Elearnmarkets (Kredent InfoEdge Pvt. Ltd.) does not provide any guarantee or assurance of returns on any investments. Past performance is not indicative of future performance.

Elearnmarkets Logo

Follow Us

Facebook-f X-twitter Instagram Linkedin-in Youtube Telegram

Register on Elearnmarkets

Continue your financial learning by creating your own account on Elearnmarkets.com

Register Free Account

Download App

Playstore logo
Download on app store

Categories

  • Basic Finance
  • Derivatives
  • Financial Planning
  • Fundamental Analysis
  • Technical Analysis
  • Mutual Funds
  • Miscellaneous

Popular On Elearnmarkets

  • Market Superheroes:
  • Vivek Bajaj
  • Chetan Panchamia
  • Ashish Kyal
  • Premal Parekh
  • Abhijit Paul
  • Jegan
  • Sivakumar Jayachadran
  • Jyoti Budhia
  • Vivek Gadodia
  • Vishal Mehta
  • Piyush Chaudhry
  • Santosh Pasi
  • Gomathi Shankar
  • Market Superheroes:
  • Vivek Bajaj
  • Chetan Panchamia
  • Ashish Kyal
  • Premal Parekh
  • Abhijit Paul
  • Jegan
  • Sivakumar Jayachadran
  • Jyoti Budhia
  • Vivek Gadodia
  • Vishal Mehta
  • Piyush Chaudhry
  • Santosh Pasi
  • Gomathi Shankar
  • Courses:​
  • Options Trading
  • Dow Theory
  • Momentum Trading
  • Stock Investing
  • Harmonic Chart Patterns
  • Algo Trading
  • Elliot Wave Theory
  • Advanced Excel
  • Cryptocurrency
  • NSE Certification Course
  • Courses:​
  • Options Trading
  • Dow Theory
  • Momentum Trading
  • Stock Investing
  • Harmonic Chart Patterns
  • Algo Trading
  • Elliot Wave Theory
  • Advanced Excel
  • Cryptocurrency
  • NSE Certification Course
  • Webinars:
  • Bank Nifty Scalping
  • Intraday Trading Strategies
  • Options Trading Strategies
  • Options selling
  • Price Action
  • Relative Strength
  • Tax Planning
  • Options Buying
  • Growth Stocks
  • Portfolio Management
  • Risk Management
  • Renko Charts
  • Crude Oil
  • Traders Psychology
  • Moving Average
  • Multibagger Stocks
  • Free Learning Modules:
  • Intraday Trading
  • Options Scalping
  • Swing Trading
  • Financial Modelling
  • RSI Indicator
  • Bollinger Bands
  • Pricing of Futures
  • Personal Finance
  • Initial Public Offerings (IPO)
  • Value Investing
  • Technical Indicators
  • Candlesticks
  • Chart Patterns
  • Option Greeks
  • ELSS Funds
  • Banking and Insurance
  • Real Estate
  • Gold
  • Book Summaries:
  • Rich Dad Poor Dad
  • Psychology of Money
  • The Intelligent Investor
  • The Richest Man in Babylon
  • Think and Trade Like a Champion
  • Value Investing and Behavioural Finance
  • Trading in the Zone
  • Learn to Earn
  • Book Summaries:
  • Rich Dad Poor Dad
  • Psychology of Money
  • The Intelligent Investor
  • The Richest Man in Babylon
  • Think and Trade Like a Champion
  • Value Investing and Behavioural Finance
  • Trading in the Zone
  • Learn to Earn
  • Tools:
  • CAGR Calculator
  • SIP Calculator
  • eLearnOptions
  • Future Value Calculator
  • Present Value Calculator
  • Atal Pension Yojana
  • Cost of Delay Calculator
  • Become a Crorepati
  • Tools:
  • CAGR Calculator
  • SIP Calculator
  • eLearnOptions
  • Future Value Calculator
  • Present Value Calculator
  • Atal Pension Yojana
  • Cost of Delay Calculator
  • Become a Crorepati

© 2025 Elearnmarkets. All Rights Reserved

  • Visit Elearnmarkets
  • Courses
  • Webinars
  • Financial Guides
  • Get Free Counselling
  • Visit Elearnmarkets
  • Courses
  • Webinars
  • Financial Guides
  • Get Free Counselling

Download Our App

No Result
View All Result
  • Article Categories
    • Basic Finance
    • Derivatives
    • Financial Planning
    • Fundamental Analysis
    • Technical Analysis
    • ETFs & Mutual Funds
    • Marketshala
    • Miscellaneous
  • Language
    • Hindi
    • Bengali
    • English
  • Courses
  • Webinars
  • Stories
Get Free Course

© 2024 Elearnmarkets All Rights Reserved

A Handbook of Technical Analysis
To start your trading journey as a seasoned technical analyst
Download Guide For FREE
Trading Mentorship Program