It’s the season of quarterly results again! Yes! It is mandatory for the listed Indian companies to file their quarterly results with the stock exchange every quarter for the four quarters ending in June, September, December and March. The March results will also include the annual results of the company.
In an era of dynamic changes, quarterly results have become important to analyse the ongoing performance of the company. These days, companies give us quarterly results and guidance for the next few quarters that serve as an essential insight for the analysts in the stock market.
If you are an investor in the stock market and like to analyse companies on your own, these questions will pop up like how to analyse quarterly results and how to read the quarterly results of a company?
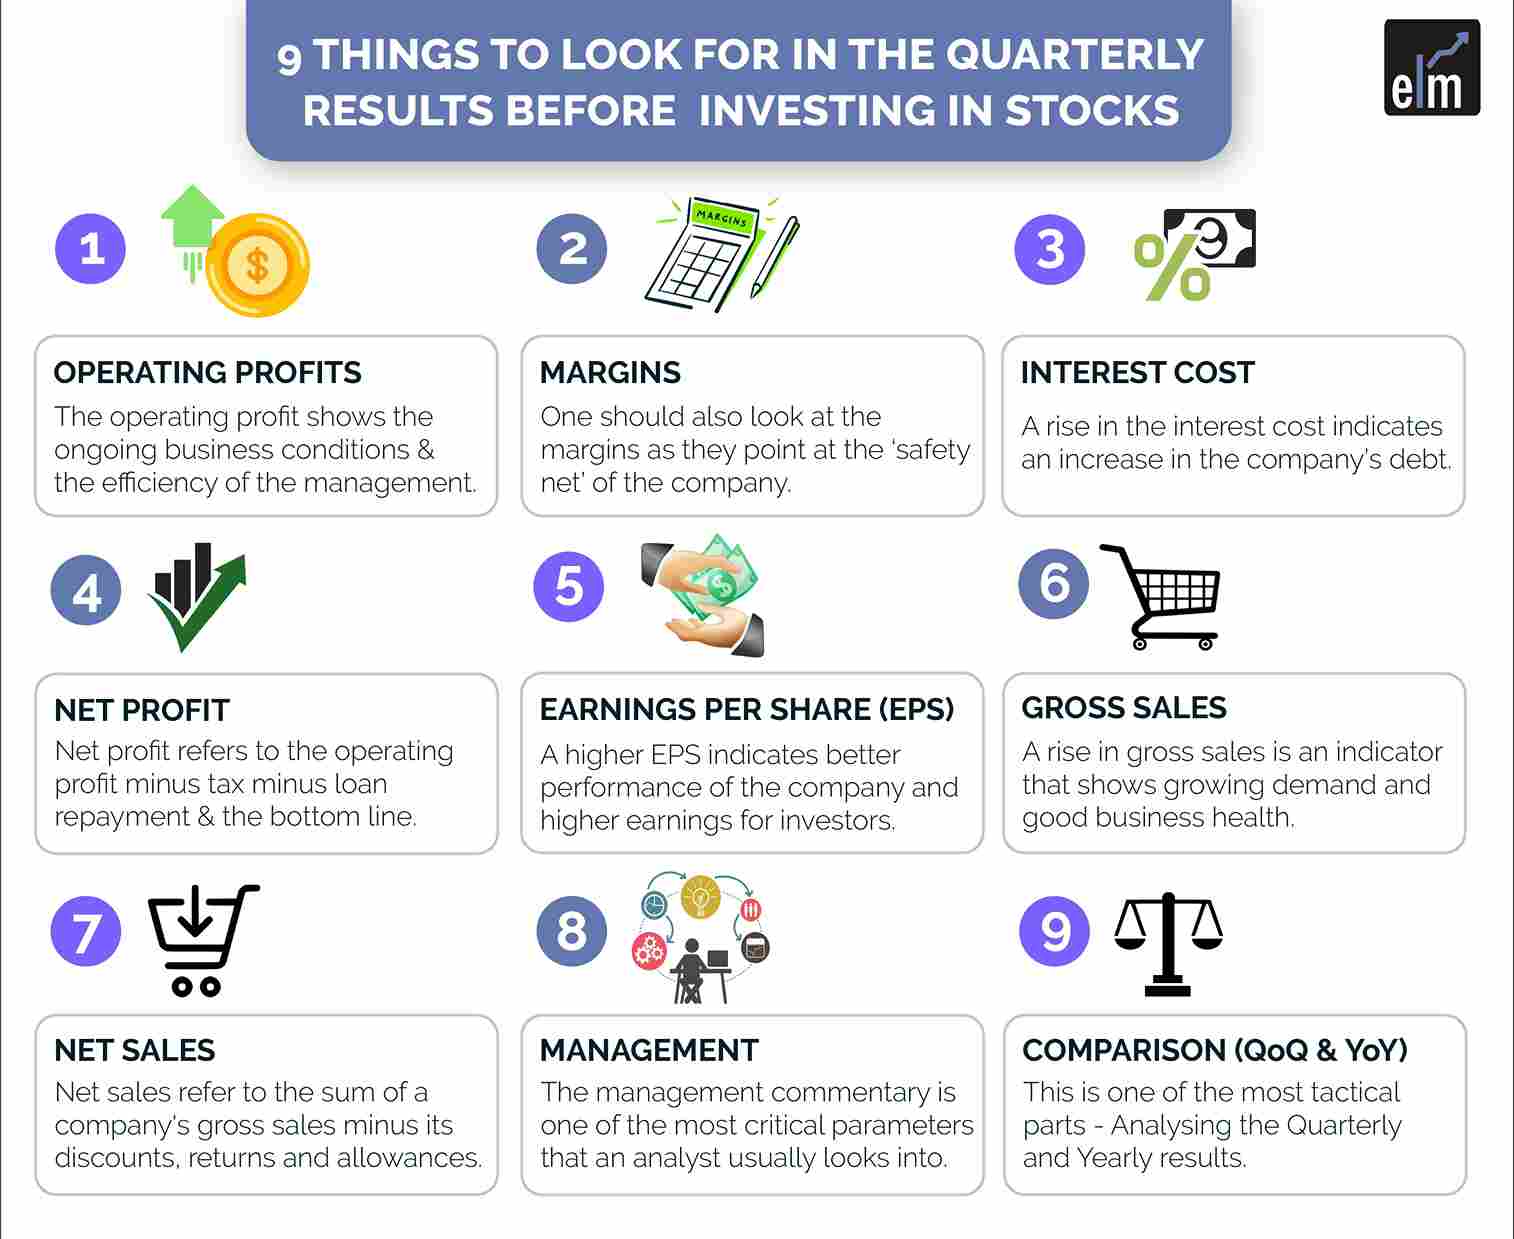
So, in today’s blog, let us discuss 9 things to look for in these quarterly results:

1. Operating Profits
When looking at the quarterly results, we should look at the operating profits. The operating profit shows the ongoing business conditions and the efficiency of the management.
One should note that a high operating profit indicates a healthy business. The formula for calculating operating profit is:
Operating profit= Net sales – Operating expenses
Operating expenses include expenses of running the business-like salaries, utility bills like rent, electricity and other office expenses.
It also includes research and development costs, legal and bank charges, among others. Other fixed and variable expenses that form a part of the operating costs need to be deducted from net sales for arriving at the business’s operating profit.
2. Margins
One should also look at the margins as they point at the ‘safety net’ of the company. The profit should not ideally come at the cost of margin.
So, when there is a decrease in the EBIT margin of the company, it indicates that the company’s profitability has taken a hit.
3. Interest Cost
Interest cost refers to the money paid for a loan amount for running a business. Hence, a rise in the interest cost indicates an increase in the company’s debt.
4. Net Profit
A company’s net profit refers to the operating profit minus tax minus loan repayment and the bottom line.
It is one of the important indicators of a company’s financial health and the most sought-after pointer in a quarterly earnings report.
One should note that the higher the company’s net profit, the higher is the profitability.
5. Earnings Per Share (EPS)
For an investor, it is essential to see how the EPS is improving. A higher EPS indicates better performance of the company, resulting in higher earnings for investors.
EPS is considered a very good indicator of the company’s performance. This, in turn, results in more earnings for the shareholders.
The EPS ratio helps investors interested in a steady source of income by providing them with an understanding of the space a company has for increasing its current dividend. EPS of a company should always be considered concerning other companies.
6. Gross Sales
Gross sales refer to a company’s total sales within a stipulated time. A rise in gross sales is an indicator that shows growing demand and good business health.
7. Net Sales
Net sales refer to the sum of a company’s gross sales minus its discounts, returns and allowances. Net sales can often get factored in when reporting on the income statements with the top-line revenues. Net sales are a better indicator of business health than gross sales.
8. Management
The management commentary is one of the most critical parameters that an analyst usually looks into.
The commentary on the current quarter and the guidance for the coming one or two years are used for forecasting and valuation purposes.
Investors need to know what the management is expecting and how it is planning for the road ahead.
Also watch our webinar on HOW TO EVALUATE MANAGEMENT QUALITY
9. Comparison on a QoQ and YoY basis:
This is one of the most tactical parts when analysing the quarterly results. So, should we analyse the quarterly result on a QoQ or a YoY basis?
Basically, in general, we put more stress on a YoY basis as it reflects the seasonality of the operations much better.
It gives a much broader view of the company’s developments. But in some sectors or companies where there are rapid changes and continuous growth, as consumption, we should also look at the QoQ changes.
For example, the Telecom industry has recently witnessed some growth in their ARPUs, so in that case, QoQ comparison makes more sense than YoY to get a fair idea of the performance of the sector or the company.
Where are the Quarterly Results of the Company Available?
You can check the list of upcoming results from StockEdge in the Forthcoming results section as shown below:
Also, you can view the results of any company by clicking on the company’s name as shown below:
Bottomline
Quarterly results help the investors by providing information that helps explain the company’s performance numbers for the particular quarter. We hope you found this blog informative and use it to its maximum potential in the practical world. Also, show some love by sharing this blog with your family and friends and helping us in our mission of spreading financial literacy.
You can learn more about similar concepts of investing through our stock market investing course.
Happy Investing!


Vivek bajaj Sir doing Great work. Trying to Provide Very Valuable Lessons of life without any money as all can afford it for best life. He is best person from where we can learn a lot. He is Best Rolemodal for everyone !!
Hi,
We really appreciated that you liked our blog! Thank you for your feedback!
Keep Reading!