Hindi: आप इस लेख को हिंदी में भी पढ़ सकते है|
Key Takeaways:
- A gap is produced when on a particular day a certain stock at its lowest price is traded higher, compared to its highest price at which it was traded on a preceding day.
- In layman’s terms, gap represents a price range at which (at the time it occurred) no shares changed hands.
- Gaps can provide clues about the price movement.
- Remember that not all gaps are genuine, some are phony as well. Genuine or valid gaps occur when the market skips a price level.
- Common gaps normally occur in calm and quiet markets, rather trendless markets.
Do you want to take a break from continuity? Thanks for nodding your head. Believe me, you are at the right place to understand it. In the language of chartists, a break from continuity is termed as “Gap” and here comes the use of Gap theory, a significant tool for technical analysis.
In layman’s terms, the gap represents a price range at which (at the time it occurred) no shares changed hands. It is the unfilled space or area in the chart. You and I being visually perfect can find many such areas or spaces on the chart.
| Table of Contents |
|---|
| Significance of Gaps in Gap Theory |
| Ex-Dividend Gaps |
| Common Gaps |
| Breakaway Gaps |
| Continuation or Runaway Gaps |
| Exhaustion gaps |
| Gap Trading Strategies |
It is produced when on a particular day a certain stock at its lowest price is traded higher, compared to its highest price at which it was traded on a preceding day. To plot the ranges of any such two days, elementary mathematics is also not required. Hence, once it gets plotted, in spite of attention deficit disorder we will be able to see, that they will not overlap or touch the same horizontal level on the chart, a gap will separate them from each other.
The fundamental reason behind a gap theory is a sudden imbalance of buy or sell orders. If we look at a broader picture, say a weekly chart, then it’s necessary at any time in a week the lowest price recorded will be higher than the highest recorded during any day of the previous week. You may argue on its frequency, yes, it is less frequent than daily gaps. The broader the time horizon the lower will be its frequency of occurrence.
Significance of Gaps in Gap Theory
Gaps can provide clues about the price movement. After all, to a chartist price is supreme. As there is an idiom “try to read between the lines”, likewise if you read the breakup from price continuity you will find that something important has happened to the fundamentals or the psychology of the crowd that has triggered this market movement. Since, the inception of technical analysis, these “holes” have always been in the limelight of the chartist.
Also Read : Mastering Trading Psychology and Money Management
There is a common superstition that “a gap must be closed.” It is further molded into “If space isn’t filled in three days, it will be filled in three weeks, and if it isn’t filled in three weeks, it will be filled in three months, etc.”
Let me dive deeply into the Gap.
Do you know what is meant by “Closing” or “Covering” a Gap? If not, I will explain you. Pick any random stock, let’s say “X”. Suppose X moves up from 50 to 51,52,53,54, and closes one day at top of its range for that day, at 55. On the next day, it opens at 56 and keeps moving up. This scenario will create a 1-point gap. Isn’t it? Yes, it’s too easy.
Now suppose X continues to climb and reaches 60. Then it stays there and comes back slowly to 55. Hope you can conclude before my next sentence. Thanks for your participation. Yes, you are correct, the gap, i.e. 55-56 has been covered. If a gap is not closed by the next minor reaction, there is a high chance it will be covered by the next Intermediate Retracement, if it still fails, then surely by the next major swing in the opposite trend. The problem is you and I are deprived of “when.”
Do you know that there may be thousands of price gaps in trading? It’s true. In spite of thinking of a microscope, you can simply look at a shorter time frame on any random chart because they are made during a single day. Sometimes such intraday gaps which a retail trader overlooks have a greater significance. Normally, a forceful breakout gives birth to a window. Remember that not all gaps are genuine, some are phony as well. Genuine or valid gaps occur when the market skips a price level. On the other hand, phony gaps occur when a financial instrument trades in another market while the market you analyze is closed.
Let’s create a larger gap. Don’t get confused. I implied extending our horizon a bit about the types of price gaps.
Ex-Dividend Gaps
It is a common gap that appears on the charts when a stock goes ex-dividend (whether the dividend is in cash, stock, rights, or warrants). A trend is governed by the Demand and Supply relation. But this gap arises due to a sudden and irreversible alteration in the book value of the issue. But nowadays a dividend-paying stock has a greater average daily range than the amount of its dividend.
Common Gaps
These gaps normally occur in calm and quiet markets, rather trendless markets. There are no new highs after an upside gap or new lows after a downside gap. You can find a slight increase in volume on the day of a common gap which returns to average volume in the following days. The absence of new highs and new lows show a lack of bullish and bearish sentiment respectively. These gaps have a tendency to occur in a price congestion pattern. A little study will tell you that they are closed rapidly within a few days. Normally they are visible in futures contracts because of late delivery, in thinly traded stocks, and at sold-out, low-volume market bottoms. It is easily visible, you don’t need to search.

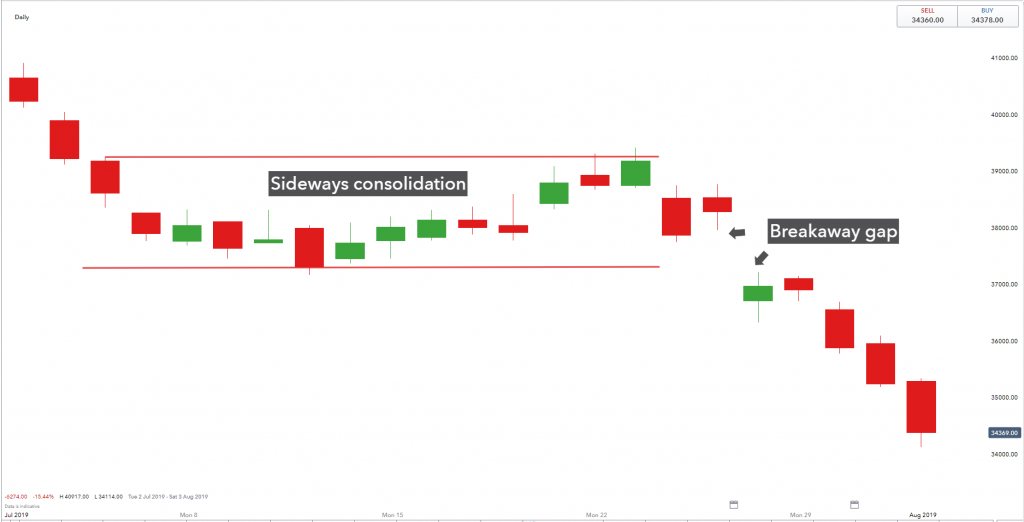
Breakaway Gaps
These gaps are also related to Price Congestion Formation. Must be thinking that what’s the difference between these gaps and common gaps. Cool. I am here to explain you. Breakaway gaps develop once the Price Congestion Formation gets completed in the move which breaks prices away supported by heavy volume.
Usually, these gaps occur on almost every decisive breakout from horizontal congestion. Though many of them are not visible on daily charts. Is any question hovering in your conscious mind? If not, then let me raise the question. You know these gaps mark a major change in crowd mentality. Should we expect these gaps to be closed within a relatively short time? You should closely analyze the volume, but when?
 Just before and after the gap. If a great many sales were recorded at the takeoff level from which prices jumped the gap, but relatively few as prices moved away from the far side of the gap, then there is a chance — perhaps about 50–50 — that the next Minor Reaction will carry prices back to the edge of the pattern of origin, thus filling the gap. On the other hand, if high volume developed at the far side of the gap, and a great many transactions took place there as prices moved on away from the gap, then the chances are remote that any near-term Throwback will close the gap. In such cases, a Throwback reaction is almost always stopped at the Outside of the gap.”

In case you apply intraday gap theory, you should examine the ticker tape. Have you learned anything? Don’t praise me. It is just the result of speculation from the book “Technical Analysis of Stock Trends”.
Continuation or Runaway Gaps
You must be reading my thought process. Okay, let me proceed. Check yourself whether you are correct or not? These gaps occur in the middle of a powerful trend, i.e. a trend which is making higher highs or lower lows without filling the gap. You know it’s almost similar to breakaway gaps, just differs in location.
It is found in the middle of a trend rather than in the beginning. Though it is less frequent compared to the above-mentioned gaps, believe me it is of far greater importance, as it signifies a further extension of the move in which it occurs. It is the only reason for its other name, “Measuring Gaps”. Let me add one more thing. Common and breakout gaps develop with Price Congestion Formation, whereas Runaway gaps occur in the course of rapid, straight-line advances or declines.
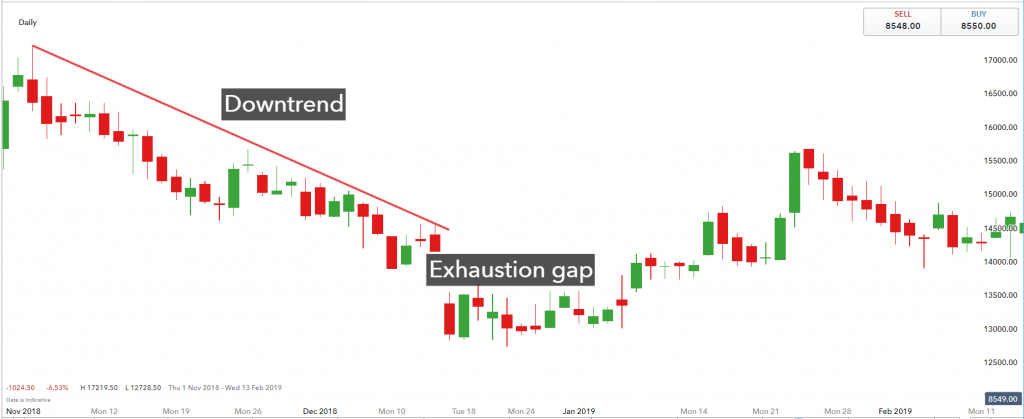
Exhaustion gaps
These gaps appear at the end of trends. Like runaway gaps, these gaps also are associated with rapid, extensive advances or declines. During uptrends, it is not followed by new highs and in case of downtrends, it is not followed by new lows. It is confirmed only when prices reverse and close it.
Gap Theory Trading Strategies:
- A breakaway gap: Sell short and place a stop a few ticks above the gap’s upper rim.
- An exhaustion gap – prices pull back into it the next day: The downtrend is over: Cover shorts immediately.
- Another exhaustion gap, marked by a lack of new highs after the gap: Several days of churning offer good shorting opportunities with a stop above the high.
- A continuation gap in a downtrend: Go short, with a stop a few ticks above the gap’s upper rim. Prices hit that stop a few days later – no method is fail-safe.
- An exhaustion gap, closed two days after it opened: Cover shorts immediately.
- A common gap in the midst of a congestion area closed the next day: No action recommended.
- A breakaway gap: Go long and place a protective stop a few ticks below the gap’s lower rim.
- A continuation gap: Add to longs and place a protective stop a few ticks below the gap’s lower rim. The gap at the right edge of the chart could be either a continuation or an exhaustion gap. Relatively quiet volume suggests continuation. If you buy, place a protective stop a few ticks below the lower rim of this gap.
The above strategies are not mine. It is the sole property of Dr. Alexander Elder. I think you have got an overview of gaps and gap theory analysis methodology. Hence, without wasting a single minute I am filling up the gap and closing the window of opportunity.
Interested in similar topics? Learn technical analysis on our platform from expert mentors now !
You can also use technical scans to filter out stocks for trading the next day by using StockEdge App, now also available in the web version.
Thanks for sharing your time. Feel free to post your suggestions and questions in the comment box below.
Happy Learning!


your all youtube series,webinar,stock edge app give very useful in trding and investing. I also see moving average webinar it will very helpful and increase my knowledge. Thank you sir
Hi Rohan,
Thank you for Reading!
Keep Reading!