Elearnmarkets - Financial Market Learning
  • Courses
  • Webinars
  • Stories
  • Language
    • English
    • Hindi
    • Bengali
No Result
View All Result
Get Free Course
  • Basic Finance
  • Derivatives
    • Futures
    • Options
  • Financial Planning
  • Fundamental Analysis
  • Technical Analysis
  • Mutual Funds
  • Marketshala
  • Miscellaneous
Elearnmarkets - Learn Stock Market, trading, investing for Free
  • Courses
  • Webinars
  • Stories
  • Language
    • English
    • Hindi
    • Bengali
No Result
View All Result
Get Free Course
Elearnmarkets - Learn Stock Market, trading, investing for Free
No Result
View All Result
Home Technical Analysis
Elliott Wave Principle

Basic tenets of Elliott Wave Principle

Elearnmarkets by Elearnmarkets
September 14, 2023
in Technical Analysis, Charts, Patterns & Indicators
Reading Time: 8 mins read
0
3.8k
VIEWS
Share on FacebookShare on XShare on WhatsApp

Have you ever noticed that if you throw a pebble at still water, it create ripples, which is essentially a small wave or series of waves?

Presently your thoughts must be crisscrossing your mind with curiosity that it’s a technical analysis blog, and I have started writing on a philosophical note instead of being logical.

It is solely because we are creatures of emotion, creatures bristling with prejudices and motivated by pride and vanity.

Our thoughts influence our decisions, causing us to behave in unpredictable or irrational ways.

On a micro level individual thoughts and cognitive biases create one’s own subjective social reality. ‘

On a macro level, we all are a social animal, thus creating a social paradigm as a whole.

Don’t take it lightly, it’s contagious.

It affects everyone, even you and me.

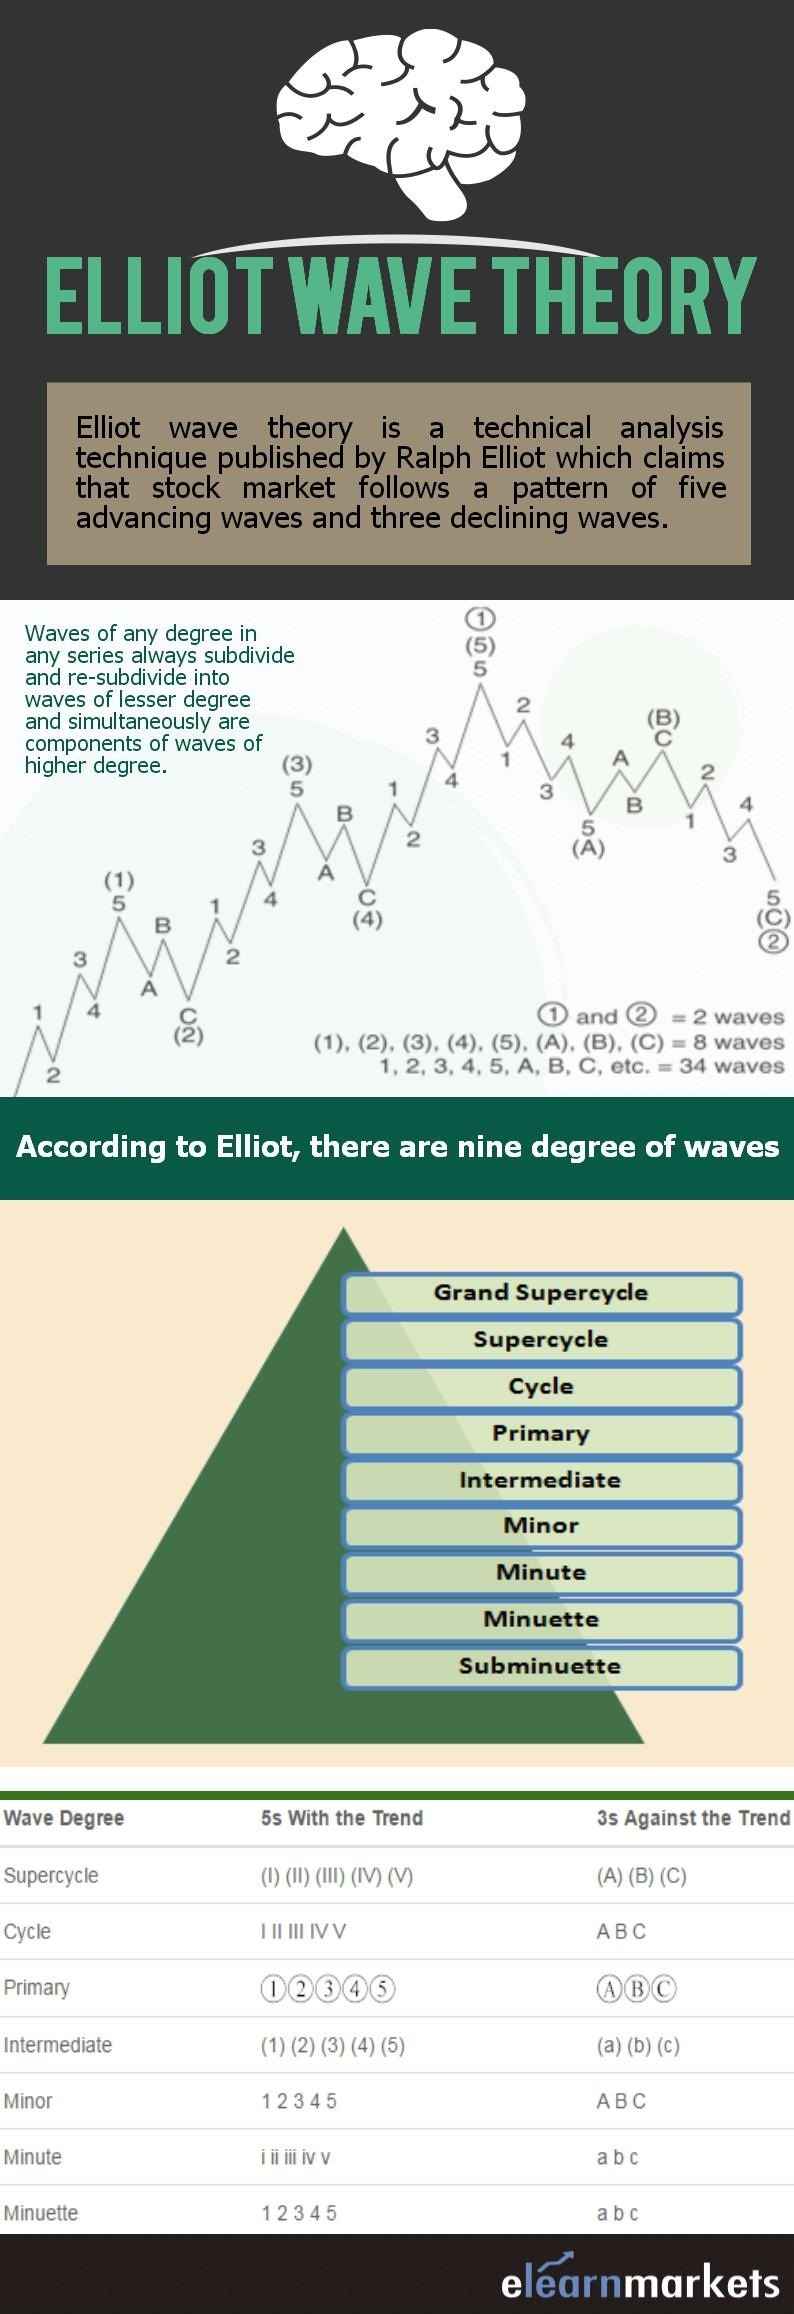
We can’t run away from it, so, it’s better to get an overview of this principle, known as “Elliott Wave Principle”. It is a key to market behavior.

In 1934, a professional accountant named Ralph Nelson Elliott discovered the underlying social principles and developed the analytical tools.

He realized that social or mass behavior ebbs and flows in trends and reverses in particular patterns.

Our mood swings and moves between optimism and pessimism creating patterns and certain structures to price movements in the financial markets, which chartists today call Elliott waves or simply waves.

Wait, let me quote this famous man “because man is subject to the rhythmical procedure, calculations having to do with his activities can be projected far into the future with a justification and certainty heretofore unattainable.”

Don’t worry I will not deep dive into this theory today. My article serves as a basic introduction to Elliot Wave Theory.

You can enroll in: Elliot Wave Principle – Key to the Market Behaviour course on Elearnmarkets to become an expert in Elliot Wave Theory.

In his research, Elliott used data of Dow Jones Industrial Average and discovered that those social patterns reflect a basic harmony found in nature.

Under this principle market decision is produced by meaningful information, which in turn produces meaningful information.

Each and every transaction irrespective of human, artificial intelligence or augmented intelligence enters the fabric of the market and get aligned to the data structure from a bit to yottabyte.

This whole process is repetitive which creates a wave pattern and thus have a predictive value.

According to him, there are thirteen waves or patterns of directional movement which are repetitive in form, but not necessarily repetitive in time or amplitude.

Let’s take a deep breath and concentrate on wave pattern. After all, where focus goes, energy flows. I promise to keep it as simple as possible.

Basic Pattern of Elliot Wave Principle

I assume you to be a chartist, being beginner is fine. If we look at a random chart we will see that price is drawn on Y-axis against time, which is drawn on X-axis.

Now let’s start at any point… I am waiting for your choice…

With the passage of time, you will notice that while we move rightward the price makes some directional movement, i.e. either northward or southward.

Hence, as the market progress, it takes the form of five waves of a special structure.

Among these, three waves which are labeled as 1, 3, and 5 effects the directional movement. It’s clearly visible that they are separated by two countertrend interruptions, which are labeled as 2 and 4 as shown in the figure below.

basic patern of elliot wave principle

Apparently, these two interruptions are mandatory for the occurrence of overall directional movement.

I hope it is clear to you.

Basic Sequence

You will notice that there are two types of waves :

a) Impulsive or motive – These waves move in the direction of the larger degree wave. Have patience, I will explain wave degree after few lines.

b) Corrective – These waves move against the direction of the larger degree wave.

Note – When the larger degree wave is moving up, advancing waves are called impulsive whereas declining waves are called corrective.

On the other hand, when the larger degree wave is moving down, advancing waves are called impulsive whereas declining waves are called corrective.

In layman’s terms “impulsive waves move with the trend” and “corrective waves move against the trend.”

Elliott Wave Theory

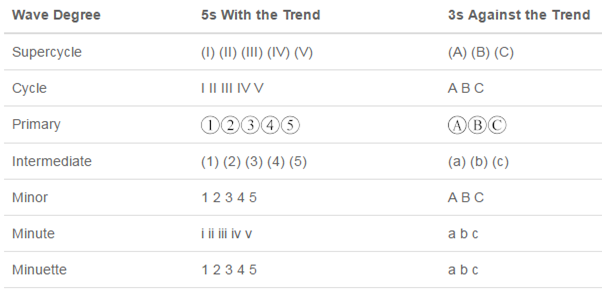
Now let me explain Wave Degree

Anything and everything under the sun can be categorized by relative size or degree.

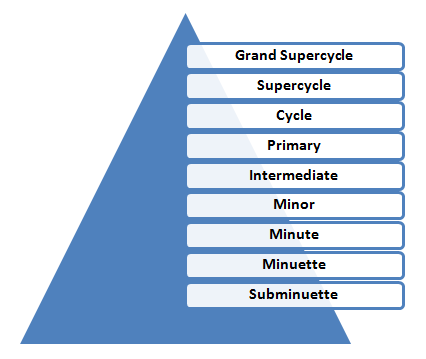
According to Elliot, there are nine degrees of waves. Quickly memorize the terms:

Figure (b)
Figure (b)
Figure (c)
Figure (c)

To know more about Eliot Wave patterns you can watch the video below:

https://www.youtube.com/watch?v=9aT7uv699ck

 A short video on “Basic tenets of Elliott Wave Principle”

The Complete Cycle of Elliott Wave Theory

Let’s start it on a serious note…

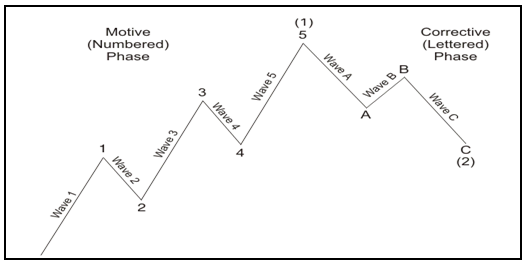
A 5 wave impulse (whose sub waves are denoted by numbers) is followed by 3 wave correction (whose sub waves are denoted by letters) to form a complete cycle of 8 waves.

This concept of 5 waves upward followed by 3 waves downward is shown in the figure below.

It is a subset of a larger set of waves.

elliott wave charts
Figure (d)

Let me share with you another figure below:

elliott wave charts
Figure (e)

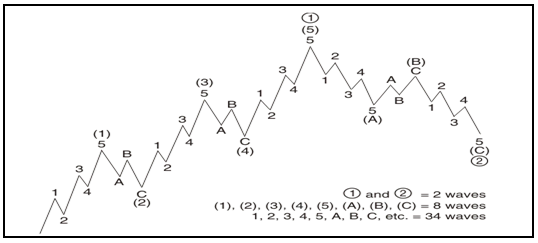
The above figure illustrates, each same-direction category of an impulsive wave, and each full cycle category (i.e., wave 1 + wave 2, or wave 3 + wave 4) of a cycle, is a smaller version of itself.

Assuming you are visually perfect, I would suggest you look at the above two figures closely…

I hope you can conclude that figure (e) is a larger version of the figure (d)

In figure (d), each sub wave 1, 3 and 5 is an impulsive wave that will subdivide into a “5,” and each sub wave 2 and 4 is a corrective wave that will subdivide into A,B,C.

If you increase your attention level then you can see that Wave (1) and Wave (2) in figure (d) would take the same form as waves and in figure (e).

Hence, waves of any degree in any series will always subdivide and re-subdivide into waves of lesser degree & simultaneously are components of waves of higher degree.

I promise not to give a single “Gyan” after this paragraph.

Bottomline:

The Fibonacci series is the basis of the wave principle.

Though when Elliott developed his model he was not aware of this series, believe me, I am not lying.

Let me quote him, “When I discovered The Wave Principle action of market trends, I had never heard of either the Fibonacci Series or the Pythagorean Diagram“, please digest it. Fibonacci series and golden ratio are inseparably interrelated to each other.

To establish support and resistance levels for market waves analysts use this ratio and related ratios.

Also Read: A comprehensive study on Support and Resistance

As an expression of gratitude, I would like to thank you for your extreme patience of going through this blog. I hope you got some clarity on “Basic tenets of Elliott Wave Principle”.

You can hop in to our Elliot wave online course and know more about it.

Be free to leave your suggestions or comments or questions in the space below.

Tags: elliott wave chartsElliott wave theoryenglishintermediate
ShareTweetSend
Get Kotak Offer Get Kotak Offer Get Kotak Offer
Previous Post

SEBI (সিকিউরিটিজ এন্ড এক্সচেঞ্জ বোর্ড অফ ইন্ডিয়া )

Next Post

Understand the Relationship Between Demand And Supply

Elearnmarkets

Elearnmarkets

Elearnmarkets (ELM) is a complete financial market portal where the market experts have taken the onus to spread financial education. ELM constantly experiments with new education methodologies and technologies to make financial education effective, affordable and accessible to all. You can connect with us on Twitter @elearnmarkets.

Related Posts

Understand Slippage in Trading
Technical Analysis

What is Slippage in Trading? Meaning & Examples

March 28, 2025
307
Breakout trading strategies
Technical Analysis

Top 5 Breakout Trading Strategies

March 12, 2025
1.1k
5 stocks for today
Technical Analysis

5 Stocks to Buy Today That Could Beat the NIFTY in 2025!

May 5, 2025
404
Image describing What is marginal trading facility
Technical Analysis

 What is a Margin Trading Facility? Advantages & Risks

April 4, 2025
665

Leave a Reply Cancel reply

Your email address will not be published. Required fields are marked *

Disclaimer

Elearnmarkets (Kredent InfoEdge Pvt. Ltd.) is a SEBI-registered Research Analyst (RA) entity (SEBI Registration No.: INH300007493). The information provided in this article is for educational and informational purposes only and should not be considered as an offer to buy or sell any securities or investment products.

The stocks, securities, and investment instruments mentioned herein are not recommendations under SEBI (Research Analysts) Regulations, 2014. Readers are advised to conduct their own due diligence and seek independent financial advice before making any investment decisions.

Investments in securities markets are subject to market risks. Please read all related documents carefully before investing. Investing in Equity Shares,
Derivatives, Mutual Funds, or other instruments carry inherent risks, including potential loss of capital. Elearnmarkets (Kredent InfoEdge Pvt. Ltd.) does not provide any guarantee or assurance of returns on any investments. Past performance is not indicative of future performance.

Elearnmarkets Logo

Follow Us

Facebook-f X-twitter Instagram Linkedin-in Youtube Telegram

Register on Elearnmarkets

Continue your financial learning by creating your own account on Elearnmarkets.com

Register Free Account

Download App

Playstore logo
Download on app store

Categories

  • Basic Finance
  • Derivatives
  • Financial Planning
  • Fundamental Analysis
  • Technical Analysis
  • Mutual Funds
  • Miscellaneous

Popular On Elearnmarkets

  • Market Superheroes:
  • Vivek Bajaj
  • Chetan Panchamia
  • Ashish Kyal
  • Premal Parekh
  • Abhijit Paul
  • Jegan
  • Sivakumar Jayachadran
  • Jyoti Budhia
  • Vivek Gadodia
  • Vishal Mehta
  • Piyush Chaudhry
  • Santosh Pasi
  • Gomathi Shankar
  • Market Superheroes:
  • Vivek Bajaj
  • Chetan Panchamia
  • Ashish Kyal
  • Premal Parekh
  • Abhijit Paul
  • Jegan
  • Sivakumar Jayachadran
  • Jyoti Budhia
  • Vivek Gadodia
  • Vishal Mehta
  • Piyush Chaudhry
  • Santosh Pasi
  • Gomathi Shankar
  • Courses:​
  • Options Trading
  • Dow Theory
  • Momentum Trading
  • Stock Investing
  • Harmonic Chart Patterns
  • Algo Trading
  • Elliot Wave Theory
  • Advanced Excel
  • Cryptocurrency
  • NSE Certification Course
  • Courses:​
  • Options Trading
  • Dow Theory
  • Momentum Trading
  • Stock Investing
  • Harmonic Chart Patterns
  • Algo Trading
  • Elliot Wave Theory
  • Advanced Excel
  • Cryptocurrency
  • NSE Certification Course
  • Webinars:
  • Bank Nifty Scalping
  • Intraday Trading Strategies
  • Options Trading Strategies
  • Options selling
  • Price Action
  • Relative Strength
  • Tax Planning
  • Options Buying
  • Growth Stocks
  • Portfolio Management
  • Risk Management
  • Renko Charts
  • Crude Oil
  • Traders Psychology
  • Moving Average
  • Multibagger Stocks
  • Free Learning Modules:
  • Intraday Trading
  • Options Scalping
  • Swing Trading
  • Financial Modelling
  • RSI Indicator
  • Bollinger Bands
  • Pricing of Futures
  • Personal Finance
  • Initial Public Offerings (IPO)
  • Value Investing
  • Technical Indicators
  • Candlesticks
  • Chart Patterns
  • Option Greeks
  • ELSS Funds
  • Banking and Insurance
  • Real Estate
  • Gold
  • Book Summaries:
  • Rich Dad Poor Dad
  • Psychology of Money
  • The Intelligent Investor
  • The Richest Man in Babylon
  • Think and Trade Like a Champion
  • Value Investing and Behavioural Finance
  • Trading in the Zone
  • Learn to Earn
  • Book Summaries:
  • Rich Dad Poor Dad
  • Psychology of Money
  • The Intelligent Investor
  • The Richest Man in Babylon
  • Think and Trade Like a Champion
  • Value Investing and Behavioural Finance
  • Trading in the Zone
  • Learn to Earn
  • Tools:
  • CAGR Calculator
  • SIP Calculator
  • eLearnOptions
  • Future Value Calculator
  • Present Value Calculator
  • Atal Pension Yojana
  • Cost of Delay Calculator
  • Become a Crorepati
  • Tools:
  • CAGR Calculator
  • SIP Calculator
  • eLearnOptions
  • Future Value Calculator
  • Present Value Calculator
  • Atal Pension Yojana
  • Cost of Delay Calculator
  • Become a Crorepati

© 2025 Elearnmarkets. All Rights Reserved

  • Visit Elearnmarkets
  • Courses
  • Webinars
  • Financial Guides
  • Get Free Counselling
  • Visit Elearnmarkets
  • Courses
  • Webinars
  • Financial Guides
  • Get Free Counselling

Download Our App

No Result
View All Result
  • Article Categories
    • Basic Finance
    • Derivatives
    • Financial Planning
    • Fundamental Analysis
    • Technical Analysis
    • ETFs & Mutual Funds
    • Marketshala
    • Miscellaneous
  • Language
    • Hindi
    • Bengali
    • English
  • Courses
  • Webinars
  • Stories
Get Free Course

© 2024 Elearnmarkets All Rights Reserved

A Handbook of Technical Analysis
To start your trading journey as a seasoned technical analyst
Download Guide For FREE
Guidebook On Chart Patterns
Take Your Trading To The Next Level With Strategies Shared In This Ebook
Download Guide For FREE
Trading Mentorship Program