In our previous Marketshala series blog, we had discussed Smart Method for Trading in Stocks in which we had discussed the ACRR Method of Intraday Trading.
In another interesting session as part of the highly popular MarketShala series conducted by Elearnmarkets, Mr. Vivek Bajaj, Co-founder Elearnmarkets, and Mr. Chetan Panchamia a prolific intraday trader and trainer with many years of experience came together to decode the basics of swing trading and the method of doing so.
Here is a short discussion of this session. If you want to get a practical understanding of swing trading, watch the full video at the end of this blog.
Basics of Swing Trading
Swing Trading is a method in which we buy the stock when it is low and sell it when it is high. Similarly, we sell the stock when it is high and buy it at low.
One should note that swing trading is different from intraday trading.
In Intraday Trading you take the position in the stocks and square off the position in the same trading session but in swing trading, the positions can be carried forward from two days to months.
This is because the Average True Range (ATR) of Nifty is 120-125 points from high to low and if you take the swing position intraday then you can get only 40-50 points for trading.
So the risk and reward ratio as a swing trader does not get fulfilled maximum times. Also, there are problems of Gap ups and Gaps down during intraday trading.
So the larger part of that Swing gets consumed by the Gap Ups and Gaps Downs.
Thus, the positions in the swing trading are usually carried forward to the next day or the overnight.
Method of Swing Trading:
Let us discuss the method or process of swing trading:
1. The Direction of the Trend:
Firstly, traders need to identify what is the direction of the trend i.e. where the trend is stopping after the uptrend or the downtrend.
The logic behind this is to identify what is the need in the market i.e. whether the buyers are aggressive or the sellers.
Buyers are aggressive because they get a trigger so they start buying and make the prices rise. Then other buyers participate in moving the prices up.
Learn the techniques to Find the Right Swing Trading Strategy in just 2 hours by Market Experts
Similarly, Sellers are aggressive because they get a trigger to sell and make the prices fall. Then other sellers participate in moving the prices down.
The trigger may be some news that may negatively affect the movement of the stock and move the prices down.
2. Wait for the pullback in the trend:
One should wait for the contra trend to come. By contra trend, we mean that the current trading trend will reverse and traders can make a profit from that reversal.
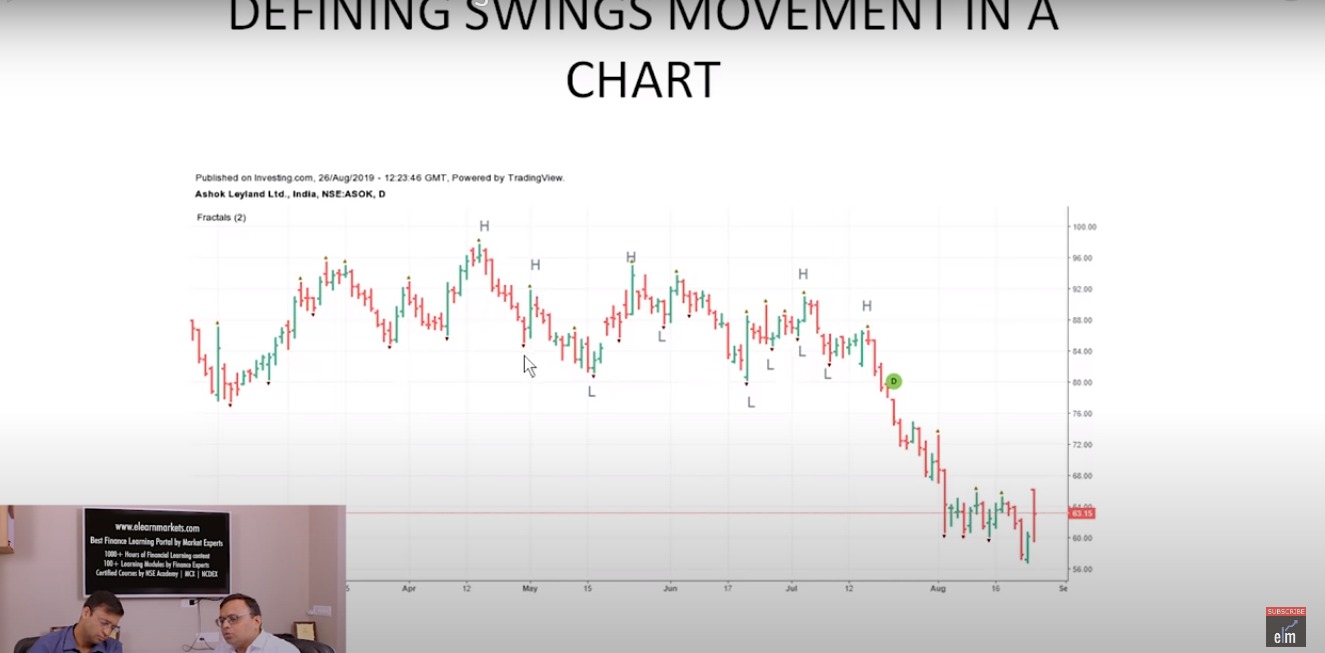
From the above chart of Ashok Leyland, we can see the swing highs (H) and the swing lows (L).
We can see that the prices make swing high at 96 and swing low at 80, the second swing high did not break the 96 levels.
So we can see that in the range of 80-96, the stock gave the traders so many opportunities for swing trading.
If the multiple lows or highs break in the market then the trend gets reversed.
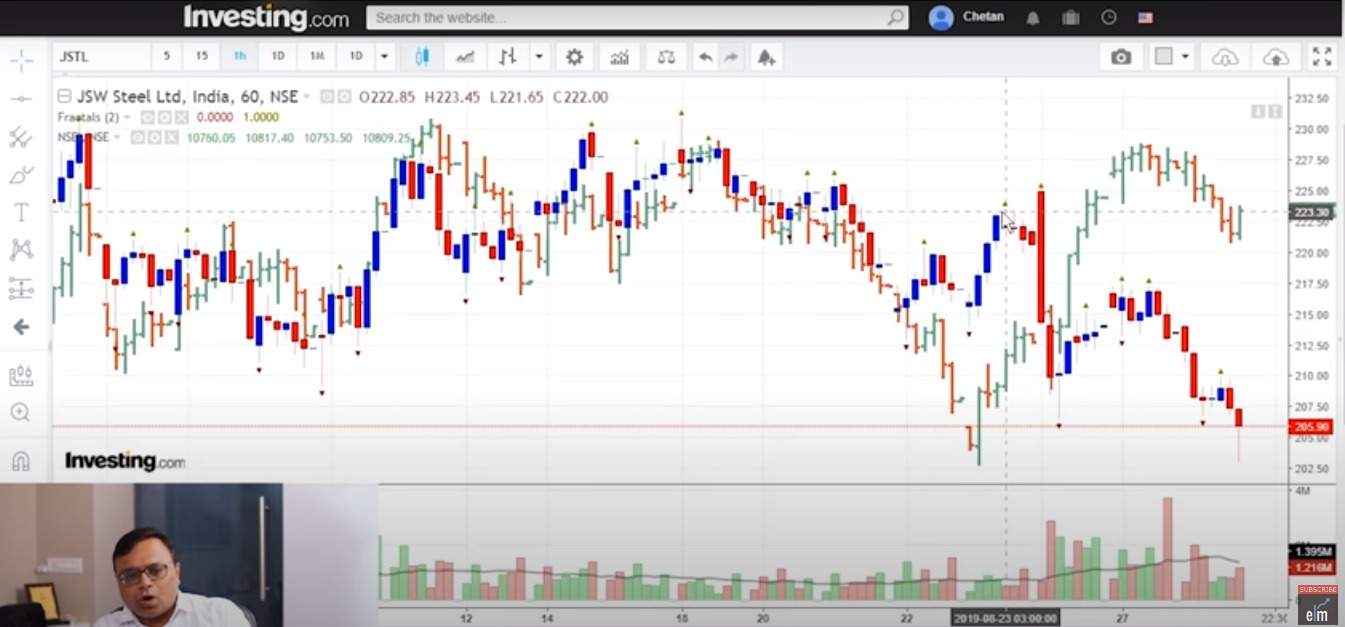
We can see in the above chart of JSW Steel Ltd. that the trend is in the downtrend.
The prices of the stock did not cross the previous support levels and at the last support level, the prices fell and reversed down.
So the traders can enter the swing selling position and sell the stock.
You may get many small swings highs and lows but one should look at a bigger swing high or low for trading.
Traders should also do the right stock selection for trading so the high probability of success can be determined.
For this we can take the help of the StockEdge scans:
Using StockEdge Scans for stock selection:
One should note that major buying or selling comes in the stock when it breaks 52-week highs or lows. So we can filter the stocks crossing 52 weeks high/low using StockEdge as shown below:
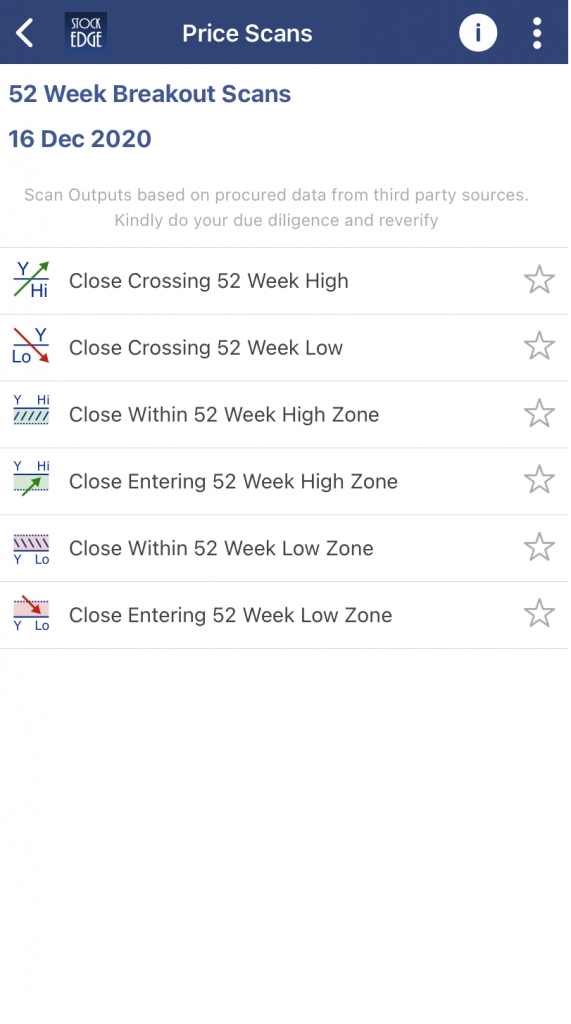
For swing trading selling one should use the scan “Close Within 52 Week Low Zone”.
One can also filter out the stocks under this scan if you want to trade in F&O stocks so that they can use options:
After selecting the stock for trading, one can compare it with how is it performing with the stock benchmark.
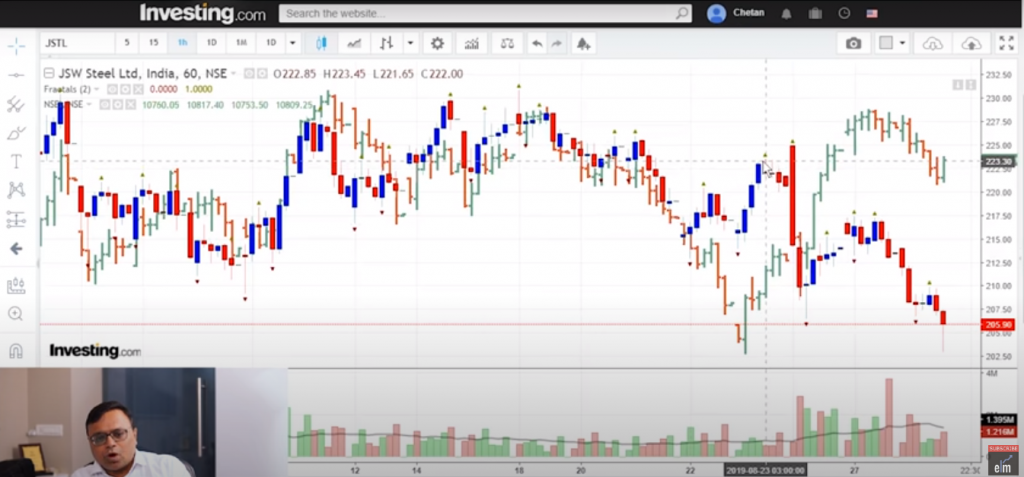
We can see in the above chart of JSW Steel Ltd. that the stock is underperforming when compared with the movement of Nifty 50.
The means that the prices of JSW Steel Ltd. are falling more than Nifty 50 thus we can assume that selling in this stock is going to come.
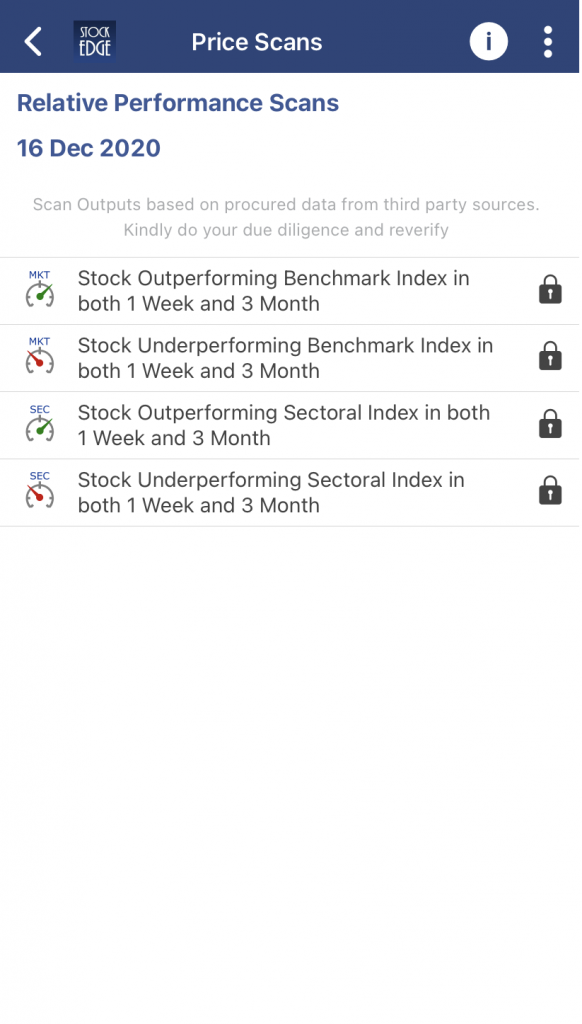
One should sell the stock when it is underperforming as compared to the benchmark and buy the stock when it is outperforming the benchmark.
This scan is also available in StockEdge and we can filter out the stocks using this scan:
You can watch the full video here:
The timeframe for taking the swing position depends upon what duration type of trader you are whether short-term or long-term trader.
One should note that no method is perfect and traders should practice the method and learn the basics of swing trading before taking trades by this method.


Good
Hi,
Thank you for Reading!
Keep Reading!
Very informative
Hi,
We are glad that you liked our post.
Thank you for Reading!