Elearnmarkets - Financial Market Learning
  • Categories
    • Basic Finance
    • Derivatives
    • Financial Planning
    • Fundamental Analysis
    • Technical Analysis
    • Marketshala
    • Miscellaneous
  • Language
    • English
    • Hindi
    • Bengali
No Result
View All Result
  • Courses
  • Webinars
  • Learn On Elearnmarkets
Elearnmarkets - Learn Stock Market, trading, investing for Free
No Result
View All Result
Home Marketshala
Option Chain - Quick Guide to know Option Buyer or Seller 1

Option Chain – Quick Guide to know Option Buyer or Seller

Elearnmarkets by Elearnmarkets
November 1, 2022
in Marketshala
Reading Time: 6 mins read
4
16.1k
VIEWS
Share on FacebookShare on TwitterShare on WhatsApp

Listen to this:

In our previous Marketshala series blog, we had discussed Swing Trading in which we had discussed the Method of Swing Trading.

In another interesting session as part of the highly popular MarketShala series conducted by Elearnmarkets, Mr. Vivek Bajaj, Co-founder Elearnmarkets, and Mr. Chetan Panchamia a prolific intraday trader and trainer with many years of experience came together to decode how to identify whether there are option buyer or sellers by analyzing the option chain and open interest data.

Here is a short discussion of this session. If you want to get a practical understanding of how to identify whether there are options buyers or sellers in the market by option chain analysis, watch the full video at the end of this blog.

Table Of Contents
  1. What to find the weighted average price?
    • Learn about options with Option Trading Made Easy Course by Market Experts
  2. How to analyze Option Chain data?
  3. How to use SuperTend Indicator with this data?

What to find the weighted average price?

For finding out whether there are option buyers or sellers we first need to calculate the weighted average price that can be calculated in the following steps:

Join TMP Join TMP Join TMP
  • Firstly we need to get the option chain of Nifty 50, so go to the NSE India website, click on the live market then equity derivatives under the options chain and you will get the option chain of Nifty 50.
  • Then we need to find out the highest open interest build-up in the call as we want to know whether there are buyers or sellers in this call open interest.
  • Click on the LTP and a window will open in which we will get details on this call open interest.
Weighted Average Price Data
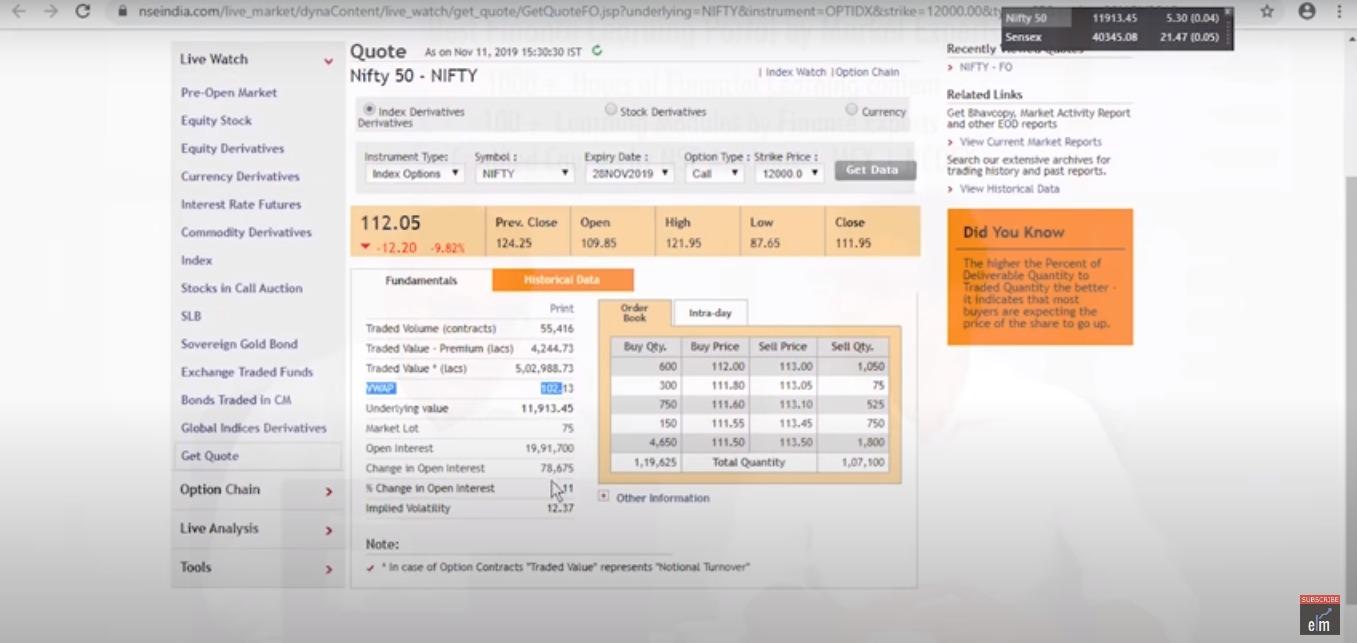
  • From the above screen we can see that the average price is Rs. 102, the closing price is Rs. 112 and the change in open interest is 78,675 shares.
  • Then we will go to the historical data and download the last one month’s data in excel.
  • After downloading the data, we need to arrange it from the lowest to the highest dates.
  • We can delete the settlement price, the number of contracts, turnover, and also the opening prices columns.
  • Make a column of average price and calculate the same. For calculating the average price, use the formula: High+Low+Close/3
  • Next, we need to calculate the change in open interest. For calculating the average price, use the formula: Today’s Open Interest- Yesterday’s Open Interest and calculate the sum.
  • Then we will multiply the average price with the change in open interest and calculate the sum of the prices.
  • To get the weighted average price we will multiply the sum of the change in open interest and the multiple of average price and the change in open interest i.e. Rs. 118.

Learn about options with Option Trading Made Easy Course by Market Experts

Open Interest Data

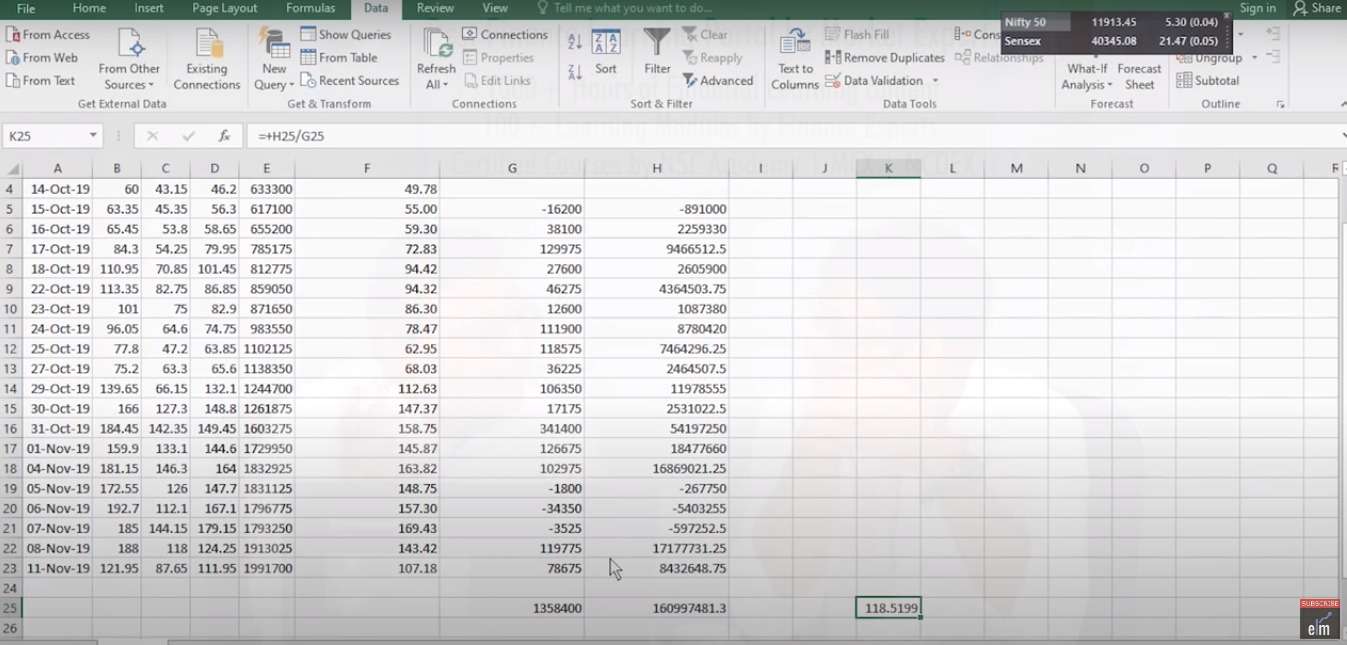
By finding the weighted average open interest price we will get to know at which price the change in the open interest is maximum.

This is the average price of all the buyers and sellers in the call so 118 is the critical level.

How to analyze Option Chain data?

Let us discuss how to analyze option chain data. Now in the chart of 12000 call of Nifty 50, we will insert the horizontal line of 118 level.

Options Chain Data Analysis

From the above chart, we can see that the option buyers and sellers are trading above the average price of Rs. 118.

But from the last candlestick, we can see that the grip of the buyer has started going down and the critical level has come around 87.

If the prices go below the 90-87 level then clearly the seller’s advantage will come and if the prices go above 180-190 levels i.e the recent high of the call then buyers’ advantage may come.

So the range between 87 and 180, can be called the grey zone or no trade zone where the buyers and sellers are fighting for the prices.

This is a dynamic concept as every day the average prices will keep changing.

Similarly, we can do this input at the highest open interest price in the option chain as we did in the call.

So we need to wait for the breakout and then enter a trade as an option buyer or seller by analyzing option chain data.

How to use SuperTend Indicator with this data?

We can also use SuperTrend Indicator to find the breakout levels using 10, 2 as the periods.

If the indicator gets positive then you can enter the buy position above the 90 levels and if the indicator gets negative below 180 level then you can enter a sell position.

If the below level of 90 gets broken and the super trend becomes negative then you enter the sell position and If the above level of 180 gets broken and the super trend becomes positive then you enter the buy position.

You can watch the full video on option chain here:

Happy Learning!

Tags: advanceoptions trading strategies
ShareTweetSend
Previous Post

Annual Report – Smart way to decode company financial health

Next Post

Share Warrants vs Rights Issue – What you should know?

Elearnmarkets

Elearnmarkets

Elearnmarkets (ELM) is a complete financial market portal where the market experts have taken the onus to spread financial education. ELM constantly experiments with new education methodologies and technologies to make financial education effective, affordable and accessible to all. You can connect with us on Twitter @elearnmarkets.

Related Posts

2 Steps that help in identifying Turnaround Stocks for Big Profits 2
Marketshala

2 Steps that help in identifying Turnaround Stocks for Big Profits

August 11, 2022
7.3k
Should Retail Traders trade in Futures or Options? 3
Marketshala

Should Retail Traders trade in Futures or Options?

August 11, 2022
4.2k
How to Exit a Stock in Stock Trading? 4
Marketshala

How to Exit a Stock in Stock Trading?

August 29, 2022
2.4k
How to earn by doing part-time Trading in Stock Market? 5
Marketshala

How to earn by doing part-time Trading in Stock Market?

August 29, 2022
4.3k

Comments 4

  1. Saayed Khan says:
    2 years ago

    Happy New Year!

    Well presented post. I liked the way your shared your article with the help of screenshot and loved the featured Image. Thank you guys for sharing post such a wonderful post. Keep posting

    Reply
    • Sakshi Agarwal says:
      2 years ago

      Hi,

      Thank you for Reading!

      Keep Reading

      Reply
  2. Aman says:
    2 years ago

    The blog is really good. Thanks for sharing it.

    Reply
    • Sakshi Agarwal says:
      2 years ago

      Hi,

      Thank you for Reading!

      Keep Reading!

      Reply

Leave a Reply Cancel reply

Your email address will not be published. Required fields are marked *

Follow Us

Facebook-f Twitter Instagram Linkedin-in Youtube Telegram

Register on Elearnmarkets

Continue your financial learning by creating your own account on Elearnmarkets.com

Register Free Account

Download App

Categories

  • Basic Finance
  • Derivatives
  • Financial Planning
  • Fundamental Analysis
  • Technical Analysis
  • Marketshala
  • Miscellaneous

Popular On Elearnmarkets

  • Market Superheroes:
  • Vivek Bajaj
  • Chetan Panchamia
  • Ashish Kyal
  • Premal Parekh
  • Abhijit Paul
  • Jegan
  • Sivakumar Jayachadran
  • Vishal Malkan
  • Jyoti Budhia
  • Vivek Gadodia
  • Vishal Mehta
  • Piyush Chaudhry
  • Santosh Pasi
  • Gomathi Shankar
  • Market Superheroes:
  • Vivek Bajaj
  • Chetan Panchamia
  • Ashish Kyal
  • Premal Parekh
  • Abhijit Paul
  • Jegan
  • Sivakumar Jayachadran
  • Vishal Malkan
  • Jyoti Budhia
  • Vivek Gadodia
  • Vishal Mehta
  • Piyush Chaudhry
  • Santosh Pasi
  • Gomathi Shankar
  • Courses:​
  • Options Trading
  • Dow Theory
  • Momentum Trading
  • Stock Investing
  • Stock Market for Beginners
  • Harmonic Chart Patterns
  • Algo Trading
  • Elliot Wave Theory
  • Advanced Excel
  • Cryptocurrency
  • NSE Certification Course
  • Courses:​
  • Options Trading
  • Dow Theory
  • Momentum Trading
  • Stock Investing
  • Stock Market for Beginners
  • Harmonic Chart Patterns
  • Algo Trading
  • Elliot Wave Theory
  • Advanced Excel
  • Cryptocurrency
  • NSE Certification Course
  • Webinars:
  • Bank Nifty Scalping
  • Intraday Trading Strategies
  • Options Trading Strategies
  • Options selling
  • Price Action
  • Relative Strength
  • Tax Planning
  • Options Buying
  • Growth Stocks
  • Portfolio Management
  • Relative Strength Index
  • Risk Management
  • Renko Charts
  • Crude Oil
  • Traders Psychology
  • Moving Average
  • Multibagger Stocks
  • Free Learning Modules:
  • Intraday Trading
  • Options Scalping
  • Swing Trading
  • Financial Modelling
  • RSI Indicator
  • Bollinger Bands
  • Pricing of Futures
  • Personal Finance
  • Initial Public Offerings (IPO)
  • Value Investing
  • Technical Indicators
  • Candlesticks
  • Chart Patterns
  • Option Greeks
  • ELSS Funds
  • Banking and Insurance
  • Real Estate
  • Gold
  • Book Summaries:
  • Rich Dad Poor Dad
  • Psychology of Money
  • The Intelligent Investor
  • The Richest Man in Babylon
  • Think and Trade Like a Champion
  • Value Investing and Behavioural Finance
  • Trading in the Zone
  • Learn to Earn
  • Book Summaries:
  • Rich Dad Poor Dad
  • Psychology of Money
  • The Intelligent Investor
  • The Richest Man in Babylon
  • Think and Trade Like a Champion
  • Value Investing and Behavioural Finance
  • Trading in the Zone
  • Learn to Earn
  • Tools:
  • CAGR Calculator
  • SIP Calculator
  • eLearnOptions
  • Future Value Calculator
  • Present Value Calculator
  • Atal Pension Yojana
  • Cost of Delay Calculator
  • Become a Crorepati
  • Tools:
  • CAGR Calculator
  • SIP Calculator
  • eLearnOptions
  • Future Value Calculator
  • Present Value Calculator
  • Atal Pension Yojana
  • Cost of Delay Calculator
  • Become a Crorepati

© 2023 Elearnmarkets. All Rights Reserved

  • Visit Elearnmarkets
  • Courses
  • Webinars
  • Financial Guides
  • Get Free Counselling
  • Visit Elearnmarkets
  • Courses
  • Webinars
  • Financial Guides
  • Get Free Counselling

Get Elearnmarkets App

No Result
View All Result
  • Article Categories
    • Basic Finance
    • Derivatives
    • Financial Planning
    • Fundamental Analysis
    • Technical Analysis
    • Marketshala
    • Miscellaneous
  • Language
    • Hindi
    • Bengali
    • English
  • Courses
  • Webinars

© 2020 Elearnmarkets All Rights Reserved